【山东省潍坊市2018届三模】新能源汽车的春天来了!2018年3月5日上午,李克强总理做政府工作报告时表示,将新能源汽车车辆购置税优惠政策再延长三年,自2018年1月1日至2020年12月31日,对购置的新能源汽车免征车辆购置税.某人计划于2018年5月购买一辆某品牌新能源汽车,他从当地该品牌销售网站了解到近五个月实际销量如下表:

(1)经分析发现,可用线性回归模型拟合当地该品牌新能源汽车实际销量 (万辆)与月份编号
 之间的相关关系.请用最小二乘法求关于的线性回归方程
 ,并预测2018年5月份当地该品牌新能源汽车的销量;
(2)2018年6月12日,中央财政和地方财政将根据新能源汽车的最大续航里程(新能源汽车的最大续航里程是指理论上新能源汽车所装的燃料或电池所能够提供给车跑的最远里程)对购车补贴进行新一轮调整.已知某地拟购买新能源汽车的消费群体十分庞大,某调研机构对其中的200名消费者的购车补贴金额的心理预期值进行了一个抽样调查,得到如下一份频数表:

(i)求这200位拟购买新能源汽车的消费者对补贴金额的心理预期值 的样本方差
的样本方差 及中位数的估计值(同一区间的预期值可用该区间的中点值代替;估计值精确到0.1);
(ii)将对补贴金额的心理预期值在 (万元)和
(万元)和 (万元)的消费者分别定义为“欲望紧缩型”消费者和“欲望膨胀型”消费者,现采用分层抽样的方法从位于这两个区间的30名消费者中随机抽取6名,再从这6人中随机抽取3名进行跟踪调查,求抽出的3人中至少有1名“欲望膨胀型”消费者的概率.
参考公式及数据:①回归方程 ,其中
,其中 ,
, ;②
;② .
.
(1)经分析发现,可用线性回归模型拟合当地该品牌新能源汽车实际销量
(万辆)与月份编号之间的相关关系.请用最小二乘法求关于的线性回归方程,并预测2018年5月份当地该品牌新能源汽车的销量;(2)2018年6月12日,中央财政和地方财政将根据新能源汽车的最大续航里程(新能源汽车的最大续航里程是指理论上新能源汽车所装的燃料或电池所能够提供给车跑的最远里程)对购车补贴进行新一轮调整.已知某地拟购买新能源汽车的消费群体十分庞大,某调研机构对其中的200名消费者的购车补贴金额的心理预期值进行了一个抽样调查,得到如下一份频数表:
(i)求这200位拟购买新能源汽车的消费者对补贴金额的心理预期值
的样本方差及中位数的估计值(同一区间的预期值可用该区间的中点值代替;估计值精确到0.1);(ii)将对补贴金额的心理预期值在
(万元)和(万元)的消费者分别定义为“欲望紧缩型”消费者和“欲望膨胀型”消费者,现采用分层抽样的方法从位于这两个区间的30名消费者中随机抽取6名,再从这6人中随机抽取3名进行跟踪调查,求抽出的3人中至少有1名“欲望膨胀型”消费者的概率.参考公式及数据:①回归方程
,其中,;②.
2018·山东潍坊·三模 查看更多[2]
更新时间:2018-06-01 09:43:55
|
相似题推荐
解答题-问答题
|
适中
(0.65)
【推荐1】某车间生产一批零件,现从中随机抽取 个零件,测量其内径的数据如下(单位:
 ):
):
 .
.
设这个数据的平均值为 ,标准差为
,标准差为 .
.
(1)求与;
(2)假设这批零件的内径 (单位:)服从正态分布
 .从这批零件中随机抽取
 个,设这个零件中内径小于
 的个数为,求
 .
.
参考数据:若 ,则
,则 ,
, ,
, .
.
个零件,测量其内径的数据如下(单位:):.设这
个数据的平均值为,标准差为.(1)求
与;(2)假设这批零件的内径
(单位:)服从正态分布.从这批零件中随机抽取个,设这个零件中内径小于的个数为,求.参考数据:若
,则,,.
您最近一年使用:0次
解答题-问答题
|
适中
(0.65)
名校
解题方法
【推荐2】某厂为估计其产品某项指标的平均数,从生产的产品中随机抽取10件作为样本,得到各件产品该项指标数据如下:9.8 10.3 10.0 10.2 9.8 10.0 10.1 10.2 9.7 9.9,将该项指标的样本平均数记为 ,样本标准差记为s,总体平均数记为
 ;
;
(1)求与s(s精确到三位小数,参考数据: )
)
(2)记样本量为n,查阅资料可知:关于的不等式 的解集是总体平均数的一个较好的估计范围;
①根据以上资料,求出该产品的总体平均数的估计范围;
②在①的估计结果下,将指标不在总体平均数的估计范围内的产品称作“超标产品”.现从这10件样品中不放回随机抽取2件,将事件“抽到的2件产品都是超标产品”记为A,求 .
.
,样本标准差记为s,总体平均数记为;(1)求
与s(s精确到三位小数,参考数据:)(2)记样本量为n,查阅资料可知:关于
的不等式的解集是总体平均数的一个较好的估计范围;①根据以上资料,求出该产品的总体平均数
的估计范围;②在①的估计结果下,将指标不在总体平均数
的估计范围内的产品称作“超标产品”.现从这10件样品中不放回随机抽取2件,将事件“抽到的2件产品都是超标产品”记为A,求.
您最近一年使用:0次
解答题-作图题
|
适中
(0.65)
名校
【推荐3】为庆祝“五四”青年节,广州市有关单位举行了“五四”青年节团知识竞赛活动,为了解全市参赛者成绩的情况,从所有参赛者中随机抽样抽取 名,将其成绩整理后分为
 组,画出频率分布直方图如图所示(最低
 分,最高
分,最高 分),但是第一、二两组数据丢失,只知道第二组的频率是第一组的
 倍.
倍.

(1)求第一组、第二组的频率各是多少?
(2)现划定成绩大于或等于上四分位数即第 百分位数为“良好”以上等级,根据直方图,估计全市“良好”以上等级的成绩范围(保留
 位小数);
位小数);
(3)现知道直方图中成绩在 内的平均数为
 ,方差为
,方差为 ,在
,在 内的平均数为
 ,方差为
,方差为 ,求成绩在
,求成绩在 内的平均数和方差.
名,将其成绩整理后分为组,画出频率分布直方图如图所示(最低分,最高分),但是第一、二两组数据丢失,只知道第二组的频率是第一组的倍. (1)求第一组、第二组的频率各是多少?
(2)现划定成绩大于或等于上四分位数即第
百分位数为“良好”以上等级,根据直方图,估计全市“良好”以上等级的成绩范围(保留位小数);(3)现知道直方图中成绩在
内的平均数为,方差为,在内的平均数为,方差为,求成绩在内的平均数和方差.
您最近一年使用:0次
解答题-应用题
|
适中
(0.65)
【推荐1】随着互联网的快速发展,基于互联网的共享单车应运而生,某市场研究人员为了了解共享单车运营公司 的经营状况,对该公司最近六个月的市场占有率进行了统计,并绘制了相应的折线图:
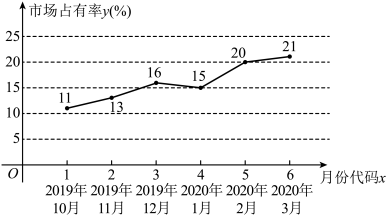
(1)由折线图可以看出,可用线性回归模型拟合月度市场占有率与月份代码 之间的关系,求关于的线性回归方程,并预测公司2020年4月的市场占有率;
(2)为进一步扩大市场,公司拟再采购一批单车,现有采购成本分别为1000元/辆和1200元/辆的 两款车型可供选择,按规定每辆单车最多使用4年,但由于多种原因(如骑行频率等)会导致单车使用寿命各不相同,考虑到公司运营的经济效益,该公司决定先对这两款车型的单车各100辆进行科学模拟测试,得到两款单车使用寿命的频数表如下:
经测算,平均每辆单车每年可以带来收入500元,不考虑除采购成本之外的其他成本,假设每辆单车的使用寿命都是整数年,且以频率作为每辆单车使用寿命的概率,如果你是公司的负责人,以每辆单车产生利润的期望值为决策依据,你会选择采购哪款车型?
参考公式:回归直线方程为 ,其中
,其中 .
.
的经营状况,对该公司最近六个月的市场占有率进行了统计,并绘制了相应的折线图:(1)由折线图可以看出,可用线性回归模型拟合月度市场占有率
与月份代码之间的关系,求关于的线性回归方程,并预测公司2020年4月的市场占有率;(2)为进一步扩大市场,公司拟再采购一批单车,现有采购成本分别为1000元/辆和1200元/辆的
两款车型可供选择,按规定每辆单车最多使用4年,但由于多种原因(如骑行频率等)会导致单车使用寿命各不相同,考虑到公司运营的经济效益,该公司决定先对这两款车型的单车各100辆进行科学模拟测试,得到两款单车使用寿命的频数表如下:寿命 车型 | 1年 | 2年 | 3年 | 4年 | 总计 |
| 20 | 35 | 35 | 10 | 100 |
| 10 | 30 | 40 | 20 | 100 |

 公司的负责人,以每辆单车产生利润的期望值为决策依据,你会选择采购哪款车型?
参考公式:回归直线方程为
,其中.
您最近一年使用:0次
解答题
|
适中
(0.65)
名校
【推荐2】为了解春季昼夜温差大小与某种子发芽多少之间的关系,现在从4月份的30天中随机挑选了5天进行研究,且分别记录了每天昼夜温差与每天每100颗种子浸泡后的发芽数,得到如下表格:
(1)从这5天中任选2天,记发芽的种子数分别为 ,求事件“均不小于25”的概率;
(2) 若由线性回归方程得到的估计数据与月份所选5天的检验数据的误差均不超过2颗,则认为得到的线性回归方程是可靠的. 请根据4月7日,4月15日与4月21日这三天的数据,求出关于的线性回归方程 ,并判定所得的线性回归方程是否可靠?
参考公式: ,
, 
参考数据: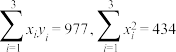
| 日期 | 4月1日 | 4月7日 | 4月15日 | 4月21日 | 4月30日 |
| 温差x/℃ | 10 | 11 | 13 | 12 | 8 |
| 发芽数y/颗 | 23 | 25 | 30 | 26 | 16 |
(1)从这5天中任选2天,记发芽的种子数分别为
,求事件“均不小于25”的概率;(2) 若由线性回归方程得到的估计数据与
月份所选5天的检验数据的误差均不超过2颗,则认为得到的线性回归方程是可靠的. 请根据4月7日,4月15日与4月21日这三天的数据,求出关于的线性回归方程,并判定所得的线性回归方程是否可靠?参考公式:
, 参考数据:
您最近一年使用:0次
解答题-问答题
|
适中
(0.65)
名校
【推荐3】前几年随着网购的普及,线下零售遭遇挑战,但随着新零售模式的不断出现,零售行业近几年呈现增长趋势,下表为2016~2019年百货零售业的销售额(单位:亿元,数据经过处理,1~4分别对应2016~2019年)
(1)由上表数据可知,可用线性回归模型拟合 与
与 的关系,请用相关系数加以说明;
(2)建立关于的回归方程,并预测2020年我国百货零售业的销售额;
(3)从2016~2019年这4年的百货零售业销售额及2020年预测销售额这5个数据中任取2个数据,求这2个数据之差的绝对值大于200亿元的概率.
参考数据: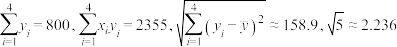 ,
,
参考公式:相关系数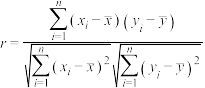 回归方程
回归方程 中斜率和截距的最小二乘估计公式分别为.
年份代码 | 1 | 2 | 3 | 4 |
销售额 | 95 | 165 | 230 | 310 |
与的关系,请用相关系数加以说明;(2)建立
关于的回归方程,并预测2020年我国百货零售业的销售额;(3)从2016~2019年这4年的百货零售业销售额及2020年预测销售额这5个数据中任取2个数据,求这2个数据之差的绝对值大于200亿元的概率.
参考数据:
,参考公式:相关系数
回归方程中斜率和截距的最小二乘估计公式分别为.
您最近一年使用:0次
解答题-问答题
|
适中
(0.65)
【推荐1】百年大计,教育为本.某校积极响应教育部号召,不断加大拔尖人才的培养力度,为清华、北大等排名前十的名校输送更多的人才.该校成立特长班进行专项培训.据统计有如下表格.(其中表示通过自主招生获得降分资格的学生人数,表示被清华、北大等名校录取的学生人数)
(1)通过画散点图发现与之间具有线性相关关系,求关于的线性回归方程;(保留两位有效数字)
(2)若已知该校2019年通过自主招生获得降分资格的学生人数为61人,预测2019年高考该校考人名校的人数;
(3)若从2014年和2018年考人名校的学生中采用分层抽样的方式抽取出5个人回校宣传,在选取的5个人中再选取2人进行演讲,求进行演讲的两人是2018年毕业的人数的分布列和期望.
参考公式: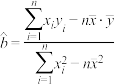 ,
,
参考数据: ,
, ,
, ,
,
表示通过自主招生获得降分资格的学生人数,表示被清华、北大等名校录取的学生人数)年份(届) | 2014 | 2015 | 2016 | 2017 | 2018 |
| 41 | 49 | 55 | 57 | 63 |
| 82 | 96 | 108 | 106 | 123 |
与之间具有线性相关关系,求关于的线性回归方程;(保留两位有效数字)(2)若已知该校2019年通过自主招生获得降分资格的学生人数为61人,预测2019年高考该校考人名校的人数;
(3)若从2014年和2018年考人名校的学生中采用分层抽样的方式抽取出5个人回校宣传,在选取的5个人中再选取2人进行演讲,求进行演讲的两人是2018年毕业的人数
的分布列和期望.参考公式:
,参考数据:
,,,
您最近一年使用:0次
解答题-问答题
|
适中
(0.65)
【推荐2】中国共产党第十九次全国代表大会会议提出“决胜全面建成小康社会”.某地随着经济的发展,居民收入逐年增长,下表是该地一银行连续五年的储蓄存款(年底余额),如表1:
为了计算的方便,工作人员将上表的数据进行了处理, ,
, 得到下表2:
(Ⅰ)求 关于的线性回归方程;
(Ⅱ)求关于的回归方程;
(Ⅲ)用所求回归方程预测到2035年年底,该地储蓄存款额可达多少?
(附:对于线性回归方程 ,其中
,其中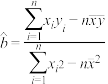 ,
, .)
.)
年份 | 2013 | 2014 | 2015 | 2016 | 2017 |
储蓄存款 | 5 | 6 | 7 | 9 | 12 |
,得到下表2:时间代号 | 1 | 2 | 3 | 4 | 5 |
| 0 | 1 | 2 | 4 | 7 |
关于的线性回归方程;(Ⅱ)求
关于的回归方程;(Ⅲ)用所求回归方程预测到2035年年底,该地储蓄存款额可达多少?
(附:对于线性回归方程
,其中,.)
您最近一年使用:0次
解答题-问答题
|
适中
(0.65)
【推荐3】大学生是国家的未来,代表着国家可持续发展的实力,能够促进国家综合实力的提高.据统计,2016年至2020年我国高校毕业生人数y(单位:万人)的数据如下表:
(1)根据上表数据,计算y与x的相关系数r,并说明y与x的线性相关性的强弱.
(已知: ,则认为y与x线性相关性很强;
 ,则认为y与x线性相关性一般;
 ,则认为y与x线性相关性较弱)
(2)求y关于x的线性回归方程,并预测2022年我国高校毕业生的人数(结果取整数).
参考公式和数据:, ,
, ,
, ,
, ,.
,.
| 年份 | 2016 | 2017 | 2018 | 2019 | 2020 |
| 年份代号x | 16 | 17 | 18 | 19 | 20 |
| 高校毕业生人数y(单位:万人) | 765 | 795 | 820 | 834 | 874 |
(1)根据上表数据,计算y与x的相关系数r,并说明y与x的线性相关性的强弱.
(已知:
,则认为y与x线性相关性很强;,则认为y与x线性相关性一般;,则认为y与x线性相关性较弱)(2)求y关于x的线性回归方程,并预测2022年我国高校毕业生的人数(结果取整数).
参考公式和数据:
,,,,,.
您最近一年使用:0次
解答题-问答题
|
适中
(0.65)
名校
解题方法
【推荐1】某学校为了了解学生暑假期间学习数学的情况,抽取了人数相等的甲、乙两班进行调查,甲班同学每天学习数学的平均时间的频率分布直方图(将时间分成
 共6组)和乙班同学每天学习数学的平均时间的频数分布表如图所示(单位:小时).
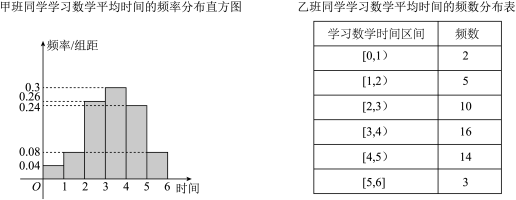
(1)从甲班每天学习数学的平均时间在 的人中随机选出3人,求3人中恰有1人学习数学的平均时间在
 范围内的概率;
(2)从甲、乙两个班每天学习数学平均时间不小于5个小时的学生中随机抽取4人进一步了解其他情况,设4人中乙班学生的人数为 ,求的分布列和数学期望.
共6组)和乙班同学每天学习数学的平均时间的频数分布表如图所示(单位:小时).(1)从甲班每天学习数学的平均时间在
的人中随机选出3人,求3人中恰有1人学习数学的平均时间在范围内的概率;(2)从甲、乙两个班每天学习数学平均时间不小于5个小时的学生中随机抽取4人进一步了解其他情况,设4人中乙班学生的人数为
,求的分布列和数学期望.
您最近一年使用:0次
解答题-应用题
|
适中
(0.65)
解题方法
【推荐2】2020年初,一场突如其来的疫情打乱了人们的生活节奏,也改变了很多人的消费方式,某集团在各地区共有20家商品销售门店,为应对疫情,确保公司商品销售营业额,集团决定在所有门店重点推行线上销售模式,经过半年的努力,公司统计了所有门店在1月~6月的商品销售营业额,发现营业额均分布在600万元~1100万元之间,其频率分布直方图如图.
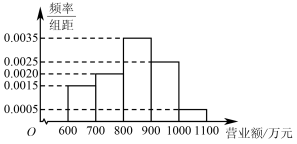
(Ⅰ)估计集团20家门店在上半年的平均营业额(同一组中的数据用该组区间的中点值作代表);
(Ⅱ)为帮助营业额落后的门店,集团决定在营业额超过900万元的门店中抽取若干家对销售额不超过700万元的门店实施一对一帮扶,规定销售额超过1000万元的门店必须参与,若甲门店上半年的销售额为950万元,求甲门店被选中的概率.
(Ⅰ)估计集团20家门店在上半年的平均营业额(同一组中的数据用该组区间的中点值作代表);
(Ⅱ)为帮助营业额落后的门店,集团决定在营业额超过900万元的门店中抽取若干家对销售额不超过700万元的门店实施一对一帮扶,规定销售额超过1000万元的门店必须参与,若甲门店上半年的销售额为950万元,求甲门店被选中的概率.
您最近一年使用:0次
解答题-问答题
|
适中
(0.65)
名校
解题方法
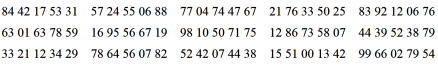
【推荐3】已知某中学高三文科班学生共有800人参加了数学与地理的水平测试,学校决定利用随机数表法从中抽取100人进行成绩抽样调查,先将800人按001,002,…,800进行编号.
(1)如果从第8行第7列的数开始向右读,请你依次写出最先检查的3个人的编号;
(下面摘取了第7行到第9行)
(2)抽取的100人的数学与地理的水平测试成绩如下表:成绩分为优秀、良好、及格三个等级;横向,纵向分别表示地理成绩与数学成绩,例如:表中数学成绩为良好的共有 .
.
①若在该样本中,数学成绩优秀率是 ,求
,求 的值:
的值:
②在地理成绩及格的学生中,已知 ,求数学成绩优秀的人数比及格的人数少的概率.
(1)如果从第8行第7列的数开始向右读,请你依次写出最先检查的3个人的编号;
(下面摘取了第7行到第9行)
(2)抽取的100人的数学与地理的水平测试成绩如下表:成绩分为优秀、良好、及格三个等级;横向,纵向分别表示地理成绩与数学成绩,例如:表中数学成绩为良好的共有
.①若在该样本中,数学成绩优秀率是
,求的值:人数 | 数学 | |||
优秀 | 良好 | 及格 | ||
地 理 | 优秀 | 7 | 20 | 5 |
良好 | 9 | 18 | 6 | |
及格 |
| 4 |
| |

 ,求数学成绩优秀的人数比及格的人数少的概率.
您最近一年使用:0次


