1 . 某种产品的广告支出费用x(单位:万元)与销售量y(单位:万件)之间的对应数据如表所示:
根据表中的数据可得回归直线方程 2.27x
2.27x ,R2≈0.96,则
①第三个样本点对应的残差 1
1
②在该回归模型对应的残差图中,残差点比较均匀地分布在倾斜 的带状区域中
③销售量的多少有96%是由广告支出费用引起的
上述结论判断中有一个是错误 的,其序号为 _____________
广告支出费用x | 2.2 | 2.6 | 4.0 | 5.3 | 5.9 |
销售量y | 3.8 | 5.4 | 7.0 | 11.6 | 12.2 |
2.27x,R2≈0.96,则①第三个样本点对应的残差
1 ②在该回归模型对应的残差图中,残差点比较均匀地分布在
③销售量的多少有96%是由广告支出费用引起的
上述结论判断中有一个是
您最近一年使用:0次
名校
2 . 下列关于回归分析的说法中错误的序号为_______
(1)残差图中残差点所在的水平带状区域越宽,则回归方程的预报精确度越高.
(2)回归直线一定过样本中心点 .
.
(3)两个模型中残差平方和越小的模型拟合的效果越好.
(4)甲、乙两个模型的 分别约为0.88和0.80,则模型乙的拟合效果更好.
(1)残差图中残差点所在的水平带状区域越宽,则回归方程的预报精确度越高.
(2)回归直线一定过样本中心点
.(3)两个模型中残差平方和越小的模型拟合的效果越好.
(4)甲、乙两个模型的
分别约为0.88和0.80,则模型乙的拟合效果更好.
您最近一年使用:0次
2020-06-23更新
|
742次组卷
|
4卷引用:黑龙江省大庆市第四中学2019-2020学年高二下学期第一次月考数学(文)试题
黑龙江省大庆市第四中学2019-2020学年高二下学期第一次月考数学(文)试题吉林省吉林市2019-2020学年高二(下)期末数学(文科)试题(已下线)专题36 相关关系与线性回归模型及其应用-2020-2021学年高中数学新教材人教A版选择性必修配套提升训练湖北省重点高中智学联盟2021-2022学年高二下学期5月联考数学试题
3 . 消费者信心指数是反映消费者信心强弱的指标;它是预测经济走势和消费趋向的一个先行指标,是监测经济周期变化的重要依据.消费者信心指数值介于0和200之间.指数超过100时,表明消费者信心处于强信心区;指数等于100时,表示消费者信心处于强弱临界点;指数小于100时,表示消费者信心处于弱信心区.我国某城市从2016年到2019年各季度的消费者信心指数如下表1:
记2016年至2019年年份序号为 ,该城市各年消费者信心指数的年均值(四舍五入取整)为y,x与y的关系如下表2:
(1)该城市在2017年和2018年的四个季度的消费者信心指数中各任取一个,求2018年的消费者信心指数不小于2017年的消费者信心指数的概率;
(2)根据表2得到线性回归方程为: ,求
,求 的值,并预报该城市2020年消费者信心指数的年平均值.
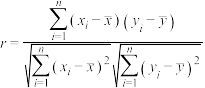
(3)根据表2计算 的相关系数r(保留两位小数),并判断是否正相关很强.
参考数据和公式: ;
; ;
; ;
; ;
; ;
; ;当
;当 时,y与x正相关很强.
| 2016年 | 2017年 | 2018年 | 2019年 | |
| 第一季度 | 104.50 | 111.70 | 118.50 | 119.30 |
| 第二季度 | 104.00 | 110.20 | 114.60 | 118.20 |
| 第三季度 | 105.50 | 114.20 | 110.20 | 118.10 |
| 第四季度 | 106.80 | 113.20 | 113.20 | 119.30 |
,该城市各年消费者信心指数的年均值(四舍五入取整)为y,x与y的关系如下表2:| 年份序号x | 1 | 2 | 3 | 4 |
| 消费者信心指数年均值y | 105 | 112 | 114 | 119 |
(2)根据表2得到线性回归方程为:
,求的值,并预报该城市2020年消费者信心指数的年平均值.(3)根据表2计算
的相关系数r(保留两位小数),并判断是否正相关很强.参考数据和公式:
;;;;;;当时,y与x正相关很强.
您最近一年使用:0次
21-22高二·全国·单元测试
4 . (1)如图是一容量为100的样本的重量的频率分布直方图,则由图可估计样本重量的中位数为12.5;
(2)在回归分析中,代表了数据点和它在回归直线上相应位置的差异的是残差平方和;
(3)如果根据性别与是否爱好运动的列联表得到 ,所以判断性别与运动有关,那么这种判断犯错的可能性不超过
 ;
;
(4)设有一个回归方程为 ,则变量
,则变量 增加一个单位时
 平均减少5个单位;
(5)两个变量与的回归模型中分别选择了4个不同模型,它们的相关指数如下,模型1的相关指数为0.98,模型2的相关指数为0.80,模型3的相关指数为0.50,模型4的相关指数为0.25.其中拟合效果最好的模型是模型4.其中正确命题的序号为__ .

(2)在回归分析中,代表了数据点和它在回归直线上相应位置的差异的是残差平方和;
(3)如果根据性别与是否爱好运动的列联表得到
,所以判断性别与运动有关,那么这种判断犯错的可能性不超过; | 0.100 | 0.050 | 0.010 |
 | 2.706 | 3.841 | 6.635 |
,则变量增加一个单位时平均减少5个单位;(5)两个变量
与的回归模型中分别选择了4个不同模型,它们的相关指数如下,模型1的相关指数为0.98,模型2的相关指数为0.80,模型3的相关指数为0.50,模型4的相关指数为0.25.其中拟合效果最好的模型是模型4.其中正确命题的序号为
您最近一年使用:0次
名校
5 . 和的散点图如图所示,则下列说法中所有正确命题的序号为______ .

①,是负相关关系;
②,之间不能建立线性回归方程;
③在该相关关系中,若用 拟合时的相关指数为
 ,用
,用 拟合时的相关指数为
 ,则
,则 .
.
和的散点图如图所示,则下列说法中所有正确命题的序号为①
,是负相关关系;②
,之间不能建立线性回归方程;③在该相关关系中,若用
拟合时的相关指数为,用拟合时的相关指数为,则.
您最近一年使用:0次
2020-06-16更新
|
1237次组卷
|
7卷引用:河南省郑州市第一中学2019-2020学年高二下期线上线下教学衔接检测数学(文)试题
河南省郑州市第一中学2019-2020学年高二下期线上线下教学衔接检测数学(文)试题(已下线)第四章复习与小结A基础练(已下线)专题09 统计- 备战2021年新高考数学纠错笔记(已下线)【新教材精创】第八章 成对数据的统计分析 -A基础练(已下线)第48讲 统计案例-2022年新高考数学二轮专题突破精练(已下线)第03讲 成对数据的统计分析 (精练)(已下线)8.1.1 变量的相关关系(分层作业)-【上好课】2022-2023学年高二数学同步备课系列(人教A版2019选修第三册)
2020高三·全国·专题练习
6 . x和y的散点图如图所示,则下列说法中①x,y是负相关关系;②在该相关关系中,若用拟合时的相关指数为 ,用
,用 拟合时的相关指数为
 则
则 ;③x,y之间不能建立线性回归方程;所有正确命题的序号为
________ .
拟合时的相关指数为,用拟合时的相关指数为则;③x,y之间不能建立线性回归方程;所有正确命题的序号为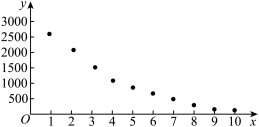
您最近一年使用:0次
2020-01-22更新
|
458次组卷
|
5卷引用:专题10.3 变量间的相关关系与统计案例(讲)【理】-《2020年高考一轮复习讲练测》
(已下线)专题10.3 变量间的相关关系与统计案例(讲)【理】-《2020年高考一轮复习讲练测》(已下线)专题10.3 变量间的相关关系与统计案例(讲)【文】-《2020年高考一轮复习讲练测》(已下线)专题10.3 变量相关性与统计案例 (精讲) -2021年高考数学(理)一轮复习讲练测(已下线)考点15 成对数据的统计相关性 2024届高考数学考点总动员【练】(已下线)8.2.1一元线性回归模型+8.2.2一元线性回归模型 第三练 能力提升拔高
名校
解题方法
7 . 给出以下命题:
①双曲线 的渐近线方程为
 ;
;
②命题“ ”是真命题;
③已知线性回归方程为 ,当变量增加
 个单位,其预报值平均增加
 个单位;
个单位;
④设随机变量ξ服从正态分布 ,若
,若 ,则
,则 ;
;
⑤设 ,则
,则
则正确命题的序号为________ (写出所有正确命题的序号).
①双曲线
的渐近线方程为;②命题“
”是真命题;③已知线性回归方程为
,当变量增加个单位,其预报值平均增加个单位;④设随机变量ξ服从正态分布
,若,则;⑤设
,则则正确命题的序号为
您最近一年使用:0次
2018-05-19更新
|
1288次组卷
|
2卷引用:【全国市级联考】重庆市綦江区2018届高三5月预测调研考试理科数学试题
12-13高三下·重庆·阶段练习
8 . 给出以下命题:
① 双曲线的渐近线方程为;
② 命题 “
“ ,
, ”是真命题;
③ 已知线性回归方程为 ,当变量增加个单位,其预报值平均增加个单位;
④ 设随机变量 服从正态分布
 ,若
,若 ,则
,则 ;
;
⑤ 已知 ,
, ,
, ,
, ,依照以上各式的规律,得到一般性的等式为
 ,(
,( )
)
则正确命题的序号为________________ (写出所有正确命题的序号).
① 双曲线
的渐近线方程为;② 命题
“,”是真命题;③ 已知线性回归方程为
,当变量增加个单位,其预报值平均增加个单位;④ 设随机变量
服从正态分布,若,则;⑤ 已知
,,,,依照以上各式的规律,得到一般性的等式为,()则正确命题的序号为
您最近一年使用:0次
2011·河北唐山·一模
解题方法
9 . 给出以下命题:
①双曲线的渐近线方程为;
②命题“”是真命题;
③已知线性回归方程为,当变量增加2个单位,其预报值平均增加4个单位;
④设随机变量 服从正态分布,若,则;
⑤设,则
则正确命题的序号为________(写出所有正确命题的序号).
①双曲线
的渐近线方程为;②命题“
”是真命题; ③已知线性回归方程为
,当变量增加2个单位,其预报值平均增加4个单位;④设随机变量
服从正态分布,若,则;⑤设
,则则正确命题的序号为________(写出所有正确命题的序号).
您最近一年使用:0次
解题方法
10 . 给出下列三个说法:
①设有一个回归直线方程,变量x增加1个单位时,y平均增加5个单位;
②设具有相关关系的两个变量x、y的相关系数为r,则 越接近于0,x和y之间的线性相关程度越强;
③在一个2×2列联表中,经计算得 的值,则的值越大,判断两个变量间有关联的把握就越大.
其中,说法错误的是______ .(写出所有满足要求的说法序号)
①设有一个回归直线方程
,变量x增加1个单位时,y平均增加5个单位;②设具有相关关系的两个变量x、y的相关系数为r,则
越接近于0,x和y之间的线性相关程度越强;③在一个2×2列联表中,经计算得
的值,则的值越大,判断两个变量间有关联的把握就越大.其中,说法错误的是
您最近一年使用:0次


