1 . 某高校统计的连续5天入校参观的人数(单位:千人)如下:
并计算得,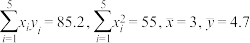 .
.
(1)求 关于
关于 的回归直线方程,并预测第10天入校参观的人数;
(2)已知该校开放1号,2号门供参观者进出,参观者从这两处门进校的概率相同,且从进校处的门离校的概率为 ,从另一处门离校的概率为
 .假设甲、乙两名参观者进出该校互不影响,已知甲、乙两名参观者从1号门离校,求他们从不同门进校的概率.
附:回归直线方程 ,其中
,其中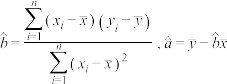 .
.
样本号 | 1 | 2 | 3 | 4 | 5 |
第 | 1 | 2 | 3 | 4 | 5 |
参观人数 | 2.4 | 2.7 | 4.1 | 6.4 | 7.9 |

 天
天 .
.(1)求
关于的回归直线方程,并预测第10天入校参观的人数;(2)已知该校开放1号,2号门供参观者进出,参观者从这两处门进校的概率相同,且从进校处的门离校的概率为
,从另一处门离校的概率为.假设甲、乙两名参观者进出该校互不影响,已知甲、乙两名参观者从1号门离校,求他们从不同门进校的概率.附:回归直线方程
,其中.
您最近一年使用:0次
名校
解题方法
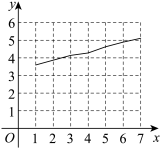
2 . 如图是我国2015年至2023年 岁及以上老人人口数(单位:亿)的折线图,
 分别对应年份
 .
.
(1)由折线图看出,可用线性回归模型拟合与 的关系,请用相关系数(结果精确到
 )加以说明;
(2)建立关于的回归方程(系数精确到),并预测2024年我国岁及以上老人人口数(单位:亿).
参考数据: ,
, ,
,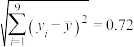 ,
, .
.
参考公式:相关系数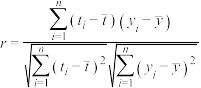 ,若
,若 ,则与有较强的线性相关性.
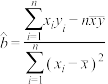
回归方程 中斜率和截距的最小二乘估计公式分别为:
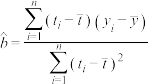 ,
, .
.
岁及以上老人人口数(单位:亿)的折线图,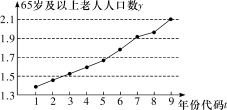
分别对应年份.(1)由折线图看出,可用线性回归模型拟合
与的关系,请用相关系数(结果精确到)加以说明;(2)建立
关于的回归方程(系数精确到),并预测2024年我国岁及以上老人人口数(单位:亿).参考数据:
,,,.参考公式:相关系数
,若,则与有较强的线性相关性.回归方程
中斜率和截距的最小二乘估计公式分别为:,.
您最近一年使用:0次
3 . 某市2017年至2023年城镇居民人均可支配收入如下表,将其绘制成散点图(如下图),发现城镇居民人均可支配收入y(单位:万元)与年份代号x具有线性相关关系.
 ,并根据所求回归方程,预测2024年该市城镇居民人均可支配收入;
(2)某分析员从2017年至2023年人均可支配收入中,任取3年的数据进行分析,记其中人均可支配收入超过4.5万的年份个数为随机变量X,求X的分布列与数学期望.
参考数据及公式: ,
,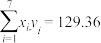 ,
, ,
, .
.
| 年份 | 2017 | 2018 | 2019 | 2020 | 2021 | 2022 | 2023 |
| 年份代号 | 1 | 2 | 3 | 4 | 5 | 6 | 7 |
| 人均可支配收入 | 3.65 | 3.89 | 4.08 | 4.30 | 4.65 | 4.90 | 5.12 |
,并根据所求回归方程,预测2024年该市城镇居民人均可支配收入;(2)某分析员从2017年至2023年人均可支配收入中,任取3年的数据进行分析,记其中人均可支配收入超过4.5万的年份个数为随机变量X,求X的分布列与数学期望.
参考数据及公式:
,,,.
您最近一年使用:0次
2024-05-31更新
|
1345次组卷
|
2卷引用:2024届山东省潍坊市二模数学试题
解题方法
4 . 为了提高某海洋公园的知名度,吸引更多游客游玩.公园管理团队决定进行自媒体直播,线上与线下同时进行门票销售,助力该海洋公园的发展.团队在前7个月的直播中,门票销售额如下表所示:
对数据进行处理后,得到如下统计量的值(符合线性回归关系):
参考公式: 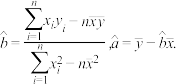
(1)根据表格中的数据,求出y关于x的线性回归方程;
(2)若直播当月销售额超过12万元,能被相关部门评选为“优秀管理团队”,请预测该团队在直播后的第几个月能被评选为“优秀管理团队”.
| 时间代码x(单位:月) | 1 | 2 | 3 | 4 | 5 | 6 | 7. |
| 销售额y(单位:万元) | 0.84 | 1.37 | 2.76 | 4.43 | 5.49 | 7.66 | 8.94 |
|
|
|
4.5 | 165.2 | 140 |


(1)根据表格中的数据,求出y关于x的线性回归方程;
(2)若直播当月销售额超过12万元,能被相关部门评选为“优秀管理团队”,请预测该团队在直播后的第几个月能被评选为“优秀管理团队”.
您最近一年使用:0次
名校
5 . 某动物园研究了大量的A、B两种相似物种.记录其身长为x(单位:m)与体重y(单位:kg),通过计算得A、B两物种的平均身长为 ,标准差分别为
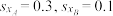 ,令A、B两物种的平均体重分别为
 、
、 若A、B两物种其体重y对身长x的回归直线分别为
 ,相关系数分别为
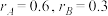 现有两种物种中一身长为5.6m,体重为8.6kg的个体P,下列说法中正确的有( )
参考公式:相关系数 回归方程中斜率和截距的最小二乘法估计公式分别为:
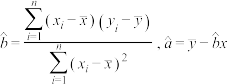 ;
;
方差: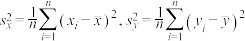
,标准差分别为,令A、B两物种的平均体重分别为、若A、B两物种其体重y对身长x的回归直线分别为,相关系数分别为现有两种物种中一身长为5.6m,体重为8.6kg的个体P,下列说法中正确的有( )参考公式:相关系数
回归方程中斜率和截距的最小二乘法估计公式分别为:;方差:
A. |
B.点 到直线 到直线 的距离大于其到直线 的距离大于其到直线 的距离 的距离 |
C.点与点 的距离大于其与点( 的距离大于其与点( 的距离 的距离 |
D.A物种的体重标准差 小于B物种的体重标准差 小于B物种的体重标准差 |
您最近一年使用:0次
名校
6 . 某商场推出“云闪付”购物活动,由于推广期内优惠力度较大,吸引了越来越多的顾客使用这种支付方式.现统计了活动刚推出一周内每天使用“云闪付”支付的人数,用表示活动推出的天数,表示每天使用该支付方式的人数,统计数据如下表所示:
根据散点图判断,在推广期内,支付的人数关于天数的回归方程适合用 表示.
表示.
(1)求该回归方程,并预测活动推出第8天使用“云闪付”的人数;( 的结果精确到0.01)
(2)推广期结束后,商场对顾客的支付方式进行统计,结果如下表:
商场规定:使用会员卡支付的顾客享8折,“云闪付”的顾客随机优惠,其它支付方式的顾客无优惠,根据统计结果得知,使用“云闪付”的顾客,享7折的概率为,享8折的概率为 ,享9折的概率为
 .设顾客购买标价为
 元的商品支付的费用为
 ,根据所给数据用事件发生的频率估计相应事件发生的概率,写出的分布列,并求
 .
.
参考数据:设 .
.
参考公式:对于一组数据 ,其回归直线
 的斜率和截距的最小二乘估计公式分别为:
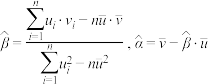 .
.
表示活动推出的天数,表示每天使用该支付方式的人数,统计数据如下表所示: | 1 | 2 | 3 | 4 | 5 | 6 | 7 |
| 6 | 13 | 25 | 40 | 73 | 110 | 201 |
关于天数的回归方程适合用表示.(1)求该回归方程,并预测活动推出第8天使用“云闪付”的人数;(
的结果精确到0.01)(2)推广期结束后,商场对顾客的支付方式进行统计,结果如下表:
| 支付方式 | 云闪付 | 会员卡 | 其它支付方式 |
| 比例 |  | |  |
,享8折的概率为,享9折的概率为.设顾客购买标价为元的商品支付的费用为,根据所给数据用事件发生的频率估计相应事件发生的概率,写出的分布列,并求.参考数据:设
.参考公式:对于一组数据
,其回归直线的斜率和截距的最小二乘估计公式分别为:.
您最近一年使用:0次
2024-05-16更新
|
1202次组卷
|
3卷引用:重庆康德卷2024年普通高等学校招生全国统一考试高三第二次联合诊断考试数学试题
重庆康德卷2024年普通高等学校招生全国统一考试高三第二次联合诊断考试数学试题 江西省宜丰中学2024届高三下学期模拟预测数学试卷(已下线)高二数学下学期期末押题--高二期末考点大串讲(苏教版2019选择性必修第二册)
名校
解题方法
7 . PM2.5是指环境空气中直径小于或等于2.5微米的颗粒物.它能较长时间悬浮于空气中,其在空气中含量越高,说明空气污染越严重.城市中的PM2.5成分除扬尘等自然因素外,燃料的燃烧也是一个重要来源.某市环境检测部门为检测燃油车流量对空气质量的影响,在一个检测点统计每日过往的燃油车流量(单位:辆)和空气中的PM2.5的平均浓度(单位: ).检测人员采集了50天的数据,制成
 列联表(部分数据缺失):
(1)完成上面的列联表,并根据小概率值 的独立性检验,能否认为PM2.5的平均浓度小于
 与燃油车日流量小于1500辆有关联?
(2)经计算得与之间的回归直线方程为 ,且这50天的燃油车的日流量的标准差
 ,PM2.5的平均浓度的标准差
 .若相关系数
 满足
满足 ,则判定所求回归直线方程有价值;否则判定其无价值.
①判断该回归直线方程是否有价值;
②若这50天的燃油车的日流量满足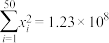 ,试求这50天的PM2.5的平均浓度的平均数
 (利用四舍五入法精确到0.1).
参考公式: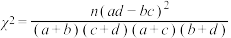 ,其中
,其中 .
.
回归方程 ,其中
,其中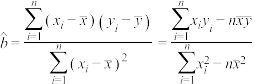 ,
, ;
;
相关系数 .
.
参考数据: ,
, ,
, .
.
(单位:辆)和空气中的PM2.5的平均浓度(单位:).检测人员采集了50天的数据,制成列联表(部分数据缺失):燃油车日流量 | 燃油车日流量 | 合计 | |
PM2.5的平均浓度 | 16 | 24 | |
PM2.5的平均浓度 | 20 | ||
| 合计 | 22 |
列联表,并根据小概率值的独立性检验,能否认为PM2.5的平均浓度小于与燃油车日流量小于1500辆有关联?(2)经计算得
与之间的回归直线方程为,且这50天的燃油车的日流量的标准差,PM2.5的平均浓度的标准差.若相关系数满足,则判定所求回归直线方程有价值;否则判定其无价值.①判断该回归直线方程是否有价值;
②若这50天的燃油车的日流量
满足,试求这50天的PM2.5的平均浓度的平均数(利用四舍五入法精确到0.1).参考公式:
,其中. | 0.01 | 0.005 | 0.001 |
 | 6.636 | 7.879 | 10.828 |
,其中,;相关系数
.参考数据:
,,.
您最近一年使用:0次
2024-05-07更新
|
1436次组卷
|
4卷引用:河南省九师联盟2024届高三下学期4月质量检测数学试题
2024·全国·模拟预测
8 . 某市一水果店为了了解柑橘的月销售量(单位:千克)与月平均气温(单位: )之间的关系,随机统计了4个月的柑橘的月销售量与当月的平均气温,其数据如下表:
由表中数据得到关于的线性回归方程为 ,气象部门预测2024年4月该市的平均气温为
 ,据此估计该水果店2024年4月柑橘的销售量为
______ 千克.
(单位:千克)与月平均气温(单位:)之间的关系,随机统计了4个月的柑橘的月销售量与当月的平均气温,其数据如下表:| 月平均气温x/ | 18 | 12 | 8 | 2 |
月销售量 千克 千克 | 26 | 45 | 62 | 77 |
关于的线性回归方程为,气象部门预测2024年4月该市的平均气温为,据此估计该水果店2024年4月柑橘的销售量为
您最近一年使用:0次
名校
解题方法
9 . 已知某水果种植基地苹果的种植面积(单位:公顷)与其产量(单位:吨)呈线性相关关系,小王准备承包一块苹果种植地,为了解市场行情,在该基地调查了5家果农,统计得到了苹果种植面积与其产量的数据如表所示:
(1)求关于的线性回归方程;
(2)若苹果的销量等于产量,且所种苹果的总利润 (单位:千元)满足
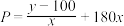 ,苹果种植面积
 ,请根据(1)的结果预测要使得单位面积的苹果利润最大,小王应该种植多少公顷的苹果?
附:回归方程 中斜率和截距的最小二乘估计公式分别为
 ,.
,.
(单位:公顷)与其产量(单位:吨)呈线性相关关系,小王准备承包一块苹果种植地,为了解市场行情,在该基地调查了5家果农,统计得到了苹果种植面积与其产量的数据如表所示:种植面积 | 1 | 2 | 3 | 4 | 5 |
产量 | 20 | 38 | 64 | 78 | 100 |
关于的线性回归方程;(2)若苹果的销量等于产量,且所种苹果的总利润
(单位:千元)满足,苹果种植面积,请根据(1)的结果预测要使得单位面积的苹果利润最大,小王应该种植多少公顷的苹果?附:回归方程
中斜率和截距的最小二乘估计公式分别为,.
您最近一年使用:0次
2024-03-25更新
|
516次组卷
|
5卷引用:宁夏银川市唐徕中学2024届高三第一次模拟理科数学试题
宁夏银川市唐徕中学2024届高三第一次模拟理科数学试题(已下线)2024年普通高等学校招生全国统一考试数学文科猜题卷(五)(已下线)2024年普通高等学校招生全国统一考试数学理科猜题卷(五)(已下线)专题8.2 一元线性回归模型及其应用【七大题型】-2023-2024学年高二数学举一反三系列(人教A版2019选择性必修第三册)(已下线)专题8.4 统计分析大题专项训练【六大题型】-2023-2024学年高二数学举一反三系列(人教A版2019选择性必修第三册)
解题方法
10 . 2023 年是全面贯彻落实党的二十大精神的开局之年,也是实施“十四五”规划承上启下的关键之年,经济增长呈现稳中有进的可喜现象.某省为做好刺梨产业的高质量发展,项目组统计了全省近5年刺梨产业综合产值如下:
年份代码x,综合产值y(单位:亿元)
(1)请通过样本相关系数,推断y与x之间的相关程度;(若,则线性相关性程度很强;若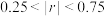 ,则线性相关性程度一般,若
 ,则线性相关性程度很弱.)
(2)求出y关于x的经验回归方程,并预测 2024 年该省刺梨产业的综合产值.
参考公式:样本相关系数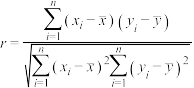 经验回归方程 中斜率和截距的最小二乘法估计公式分别为
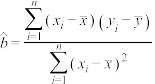 ,
, .
.
参考数据:
年份代码x,综合产值y(单位:亿元)
年份 | 2019 | 2020 | 2021 | 2022 | 2023 |
年份代码x | 1 | 2 | 3 | 4 | 5 |
综合产值y | 1.5 | 2 | 3.5 | 8 | 15 |
(1)请通过样本相关系数,推断y与x之间的相关程度;(若
,则线性相关性程度很强;若,则线性相关性程度一般,若,则线性相关性程度很弱.)(2)求出y关于x的经验回归方程,并预测 2024 年该省刺梨产业的综合产值.
参考公式:样本相关系数
经验回归方程 中斜率和截距的最小二乘法估计公式分别为,.参考数据:
您最近一年使用:0次
2024-03-21更新
|
984次组卷
|
6卷引用:黑龙江省双鸭山市第三十一中学等校2024届高三第二次模拟数学试题
黑龙江省双鸭山市第三十一中学等校2024届高三第二次模拟数学试题黑龙江省部分学校2023-2024学年高三下学期第二次模拟考试数学试题(已下线)第三套 艺体生新高考全真模拟 (二模重组卷)(已下线)【一题多变】 相关关系 回归分析(已下线)9.1 线性回归分析(3)(已下线)专题8.2 一元线性回归模型及其应用【七大题型】-2023-2024学年高二数学举一反三系列(人教A版2019选择性必修第三册)


