解题方法
1 . 红铃虫是棉花的主要害虫之一,某科研所研究人员对其繁殖情况进行了研究,发现其繁殖的数量y(单位:个)随时间x(单位:天)的变化情况如下表:
表一
令 ,w与y的对应关系如下表
表二
(1)根据表一画出散点图,并判断用两种模型① ②
② 进行拟合,哪种模型更为合适?(给出判断即可,不需要说明理由);

(2)根据(1)中所选择的模型,求出y关于x的回归方程(计算过程中四舍五入保留两位小数).
(3)要使其繁殖数量不超过4000个,预测繁殖天数不超过多少天.
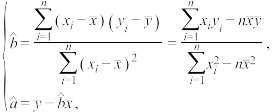
参考公式:经验回归方程 ,其中
,其中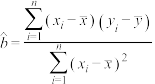 ,
,
参考数据: ,
, ,
, ,
, ,
,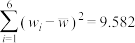 ,
,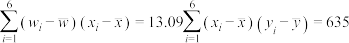 ,
,
表一
x | 1 | 2 | 3 | 4 | 5 | 6 |
y | 5 | 10 | 25 | 50 | 100 | 200 |
,w与y的对应关系如下表表二
y | 5 | 10 | 25 | 50 | 100 | 200 |
w | 1.61 | 2.30 | 3.22 | 3.91 | 4.61 | 5.30 |
②进行拟合,哪种模型更为合适?(给出判断即可,不需要说明理由);(2)根据(1)中所选择的模型,求出y关于x的回归方程(计算过程中四舍五入保留两位小数).
(3)要使其繁殖数量不超过4000个,预测繁殖天数不超过多少天.
参考公式:经验回归方程
,其中,参考数据:
,,,,,,
您最近一年使用:0次
解题方法
2 . 某厂A车间为了确定合理的工时定额,需要确定加工零件所花费的时间,为此作了五次试验,得到数据如下:
(1)在给定的坐标系中画出散点图;
(2)求出y关于x的回归方程;
(3)试预测加工9个零件需要多少时间?
参考公式: ,
, .
.
| 加工零件的个数x | 1 | 2 | 3 | 4 | 5 |
| 加工的时间y(小时) | 1.5 | 2.4 | 3.2 | 3.9 | 4.5 |
(2)求出y关于x的回归方程;
(3)试预测加工9个零件需要多少时间?
参考公式:
,.
您最近一年使用:0次
2022-01-28更新
|
295次组卷
|
2卷引用:四川省宜宾市2021-2022学年高二上学期期末数学文科试题
名校
解题方法
3 . 为落实国家扶贫攻坚政策,某地区应上级扶贫办的要求,对本地区所有贫困户每年年底进行收入统计,下表是该地区 贫困户从2017年至2020年的收入统计数据:(其中y为贫困户的人均年纯收入)
(1)在给定的坐标系中画出A贫困户的人均年纯收入关于年份代码的散点图;
(2)根据上表数据,用最小二乘法求出y关于x的线性回归方程 ,并估计A贫困户在
 年能否脱贫.(注:假定脱贫标准为人均年纯收入不低于
 元)
元)
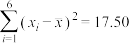
参考公式: ,
,
参考数据: ,
, .
.
贫困户从2017年至2020年的收入统计数据:(其中y为贫困户的人均年纯收入)| 年份 | 2017年 | 2018年 | 2019年 | 2020年 |
年份代码 | 1 | 2 | 3 | 4 |
| 人均年纯收入y/百元 | 25 | 28 | 32 | 35 |
(1)在给定的坐标系中画出A贫困户的人均年纯收入关于年份代码的散点图;
(2)根据上表数据,用最小二乘法求出y关于x的线性回归方程
,并估计A贫困户在年能否脱贫.(注:假定脱贫标准为人均年纯收入不低于元)参考公式:
,参考数据:
,.
您最近一年使用:0次
2022-01-28更新
|
180次组卷
|
2卷引用:陕西省榆林市2021-2022学年高二上学期期末理科数学试题
4 . 某统计部门依据《中国统计年鉴——2017》提供的数据,对我国1997-2016年的国内生产总值(GDP)进行统计研究,作出了两张散点图:图1表示1997-2016年我国的国内生产总值(GDP),图2表示2007-2016年我国的国内生产总值(GDP).
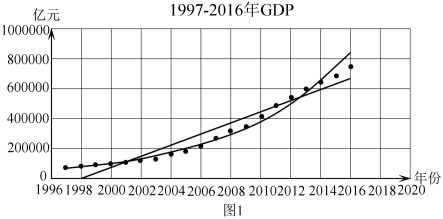
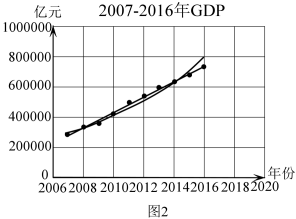
(1)用 表示第i张图中的年份与GDP的线性相关系数,
 ,依据散点图的特征分别写出
 的结果;
的结果;
(2)分别用线性回归模型和指数回归模型对两张散点图进行回归拟合,分别计算出统计数据——相关指数 的数值,部分结果如下表所示:
①将上表中的数据补充完整(结果保留3位小数,直接写在答题卡上);
②若估计2017年的GDP,结合数据说明采用哪张图中的哪种回归模型会更精准一些?若按此回归模型来估计,2020年的GDP能否突破100万亿元?事实上,2020年的GDP刚好突破了100万亿元,估计与事实是否吻合?结合散点图解释说明.
(1)用
表示第i张图中的年份与GDP的线性相关系数,,依据散点图的特征分别写出的结果;(2)分别用线性回归模型和指数回归模型对两张散点图进行回归拟合,分别计算出统计数据——相关指数
的数值,部分结果如下表所示:| 年份 | 1997-2016 | 2007-2016 |
| 线性回归模型 | 0.9306 | |
| 指数回归模型 | 0.9899 | 0.978 |
②若估计2017年的GDP,结合数据说明采用哪张图中的哪种回归模型会更精准一些?若按此回归模型来估计,2020年的GDP能否突破100万亿元?事实上,2020年的GDP刚好突破了100万亿元,估计与事实是否吻合?结合散点图解释说明.
您最近一年使用:0次
2022-01-12更新
|
1161次组卷
|
4卷引用:河北省唐山市2022届高三上学期期末数学试题
河北省唐山市2022届高三上学期期末数学试题(已下线)专题23 回归方程- 2022届高考数学一模试题分类汇编(新高考卷)(已下线)第01讲 线性回归分析-【帮课堂】2021-2022学年高二数学同步精品讲义(苏教版2019选择性必修第二册)河北省沧州市海兴县2023届高三上学期12月调研数学试题
21-22高一上·全国·课后作业
5 . 生物节律是描述体温、血压和其他易变的生物变化的每日生物模型.下表中给出了在24h期间人的体温的典型变化(从夜间零点开始计时).
(1)作出这些数据的散点图;
(2)选用一个三角函数来近似描述这些数据;
(3)在散点图中作出(2)中所选函数的图象.
| 时间 | 0 | 2 | 4 | 6 | 8 | 10 | 12 | 14 | 16 | 18 | 20 | 22 | 24 |
| 温度 | 36.8 | 36.7 | 36.6 | 36.7 | 36.8 | 37.0 | 37.2 | 37.3 | 37.4 | 37.3 | 37.2 | 37.0 | 36.8 |
(2)选用一个三角函数来近似描述这些数据;
(3)在散点图中作出(2)中所选函数的图象.
您最近一年使用:0次
解题方法
6 . 理论预测某城市2020到2024年人口总数与年份的关系如下表所示:
(1)请画出上表数据的散点图;
(2)指出与 是否线性相关;
(3)若与线性相关,请根据上表提供的数据,用最小二乘法求出关于的回归方程;
(4)据此估计2025年该城市人口总数.
(参数数据: ,
, )
)
年份 | 0 | 1 | 2 | 3 | 4 |
人口数 | 5 | 7 | 8 | 11 | 19 |
 (年)
(年)(2)指出
与是否线性相关;(3)若
与线性相关,请根据上表提供的数据,用最小二乘法求出关于的回归方程;(4)据此估计2025年该城市人口总数.
(参数数据:
,)
您最近一年使用:0次
解题方法
7 . 某特色餐馆开通了美团外卖服务,在一周内的某特色菜外卖份数(份)与收入(元)之间有如下的对应数据:
(1)画出散点图;
(2)请根据以上数据用最小二乘法原理求出收入关于份数的线性回归方程;
(3)据此估计外卖份数为 份时,收入为多少元.
注:①参考方式:线性回归方程系数公式 ,
, ;
;
②参考数据: ,
, ,
, .
.
(份)与收入(元)之间有如下的对应数据:外卖分数 |
|
|
|
|
|
收入 |
|
|
|
|
|


(1)画出散点图;
(2)请根据以上数据用最小二乘法原理求出收入
关于份数的线性回归方程;(3)据此估计外卖份数为
份时,收入为多少元.注:①参考方式:线性回归方程系数公式
,;②参考数据:
,,.
您最近一年使用:0次
名校
解题方法
8 . 某车间为了规定工时定额,需要确定加工零件所花费的时间,为此作了四次试验,得到数据如下:
(1)在给定的坐标系中画出表中数据的散点图;
(2)求出y关于x的线性回归方程,并在坐标系中画出回归直线;
(3)试预测加工10个零要多少时间?
| 零件的个数x(个) | 2 | 3 | 4 | 5 |
| 加工的时间y(小时) | 2.5 | 3 | 4 | 4.5 |
(1)在给定的坐标系中画出表中数据的散点图;
(2)求出y关于x的线性回归方程
,并在坐标系中画出回归直线;(3)试预测加工10个零要多少时间?
您最近一年使用:0次
解题方法
9 . 研究某灌溉渠道水的流速与水深之间的关系,测得一组数据如表:
(1)画出散点图,并求对的回归直线方程;
(2)预测水深为 时水的流速是多少?
与水深之间的关系,测得一组数据如表:水深 |  |  |  |  |  |  |  |  |
流速 | |  |  |  |  | |  |  |
对的回归直线方程;(2)预测水深为
时水的流速是多少?
您最近一年使用:0次
名校
10 . 近年来,“双11”网购的观念逐渐深入人心,某人统计了近5年某网站“双11”当天的交易额,统计结果如下表:
请根据表中提供的数据,画出散点图,推断两个变量是否近似地呈现线性关系,若是,用样本相关系数 说明
说明 与
与 的线性相关程度(保留三位小数);若不是,请说明理由.
附: .
.
| 年份 | 2016 | 2017 | 2018 | 2019 | 2020 |
| 年份代码 | 1 | 2 | 3 | 4 | 5 |
| 交易额/百亿元 | 9 | 12 | 17 | 21 | 26 |
说明与的线性相关程度(保留三位小数);若不是,请说明理由.附:
.
您最近一年使用:0次
2021-09-24更新
|
112次组卷
|
2卷引用:北师大版(2019) 选修第一册 突围者 第七章 第一节 一元线性回归


