1 . 为了研究y关于x的线性相关关系,收集了5对样本数据(见表格),若已求得一元线性回归方程为 ,则下列选项中正确的是( )
,则下列选项中正确的是( ) | 1 | 2 | 3 | 4 | 5 |
 |  |  | 1 |  |  |
A. |
B.当 时的残差为 时的残差为 |
| C.样本数据y的40百分位数为1 |
D.去掉样本点 后,y与x的相关系数不会改变 后,y与x的相关系数不会改变 |
您最近一年使用:0次
2 . “南澳牡蛎”是我国地理标志产品,产量高、肉质肥、营养好,素有“海洋牛奶精品”的美誉.2024年该基地考虑增加人工投入,现有以往的人工投入增量x(人)与年收益增量y(万元)的数据如下:
该基地为了预测人工投入增量为16人时的年收益增量,建立了y与x的两个回归模型:
模型①:由最小二乘公式可求得y与x的线性回归方程: ;
;
模型②:由散点图的样本点分布,可以认为样本点集中在曲线: 的附近,对人工投入增量x做变换,令
 ,则
,则 ,且有
,且有 ,
, ,
, ,
, .
.
(ii)根据下列表格中的数据,比较两种模型的决定系数 ,并选择拟合精度更高、更可靠的模型,预测人工投入增量为16人时的年收益增量.
(2)根据养殖规模与以往的养殖经验,产自某南澳牡蛎养殖基地的单个“南澳牡蛎”质量(克)在正常环境下服从正态分布 .购买10只该基地的“南澳牡蛎”,会买到质量小于20g的牡蛎的可能性有多大?
附:若随机变量 ,则
,则 ,
, ;
;
样本 的最小二乘估计公式为:
 ,
, ,
, .
.
| 人工投入增量x(人) | 2 | 3 | 4 | 6 | 8 | 10 | 13 |
| 年收益增量y(万元) | 13 | 22 | 31 | 42 | 50 | 56 | 58 |
模型①:由最小二乘公式可求得y与x的线性回归方程:
;模型②:由散点图的样本点分布,可以认为样本点集中在曲线:
的附近,对人工投入增量x做变换,令,则,且有,,,.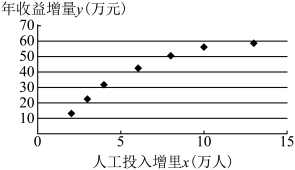
(ii)根据下列表格中的数据,比较两种模型的决定系数
,并选择拟合精度更高、更可靠的模型,预测人工投入增量为16人时的年收益增量.| 回归模型 | 模型① | 模型② |
| 回归方程 | | |
 | 182.4 | 79.2 |
(2)根据养殖规模与以往的养殖经验,产自某南澳牡蛎养殖基地的单个“南澳牡蛎”质量(克)在正常环境下服从正态分布
.购买10只该基地的“南澳牡蛎”,会买到质量小于20g的牡蛎的可能性有多大?附:若随机变量
,则,;样本
的最小二乘估计公式为:,,.
您最近一年使用:0次
名校
解题方法
3 . 某航天公司研发了一种火箭推进器,为测试其性能,对推进器飞行距离与损坏零件数进行了统计,数据如下:
(1)建立关于的回归模型 ,根据所给数据及回归模型,求回归方程及相关系数
 .(
.( 精确到0.1,
 精确到1,精确到0.0001)
(2)该公司进行了第二次测试,从所有同型号推进器中随机抽取100台进行等距离飞行测试,对其中60台进行飞行前保养,测试结束后,有20台报废,其中保养过的推进器占比 ,请根据统计数据完成
 列联表,并根据小概率值
 的独立性检验,能否认为推进器是否报废与保养有关?
附: ,
,
飞行距离 | 56 | 63 | 71 | 79 | 90 | 102 | 110 | 117 |
| 损坏零件数(个) | 61 | 73 | 90 | 105 | 119 | 136 | 149 | 163 |
关于的回归模型,根据所给数据及回归模型,求回归方程及相关系数.(精确到0.1,精确到1,精确到0.0001)(2)该公司进行了第二次测试,从所有同型号推进器中随机抽取100台进行等距离飞行测试,对其中60台进行飞行前保养,测试结束后,有20台报废,其中保养过的推进器占比
,请根据统计数据完成列联表,并根据小概率值的独立性检验,能否认为推进器是否报废与保养有关?| 保养 | 未保养 | 合计 | |
| 报废 | 20 | ||
| 未报废 | |||
| 合计 | 60 | 100 |
, | 0.050 | 0.010 | 0.001 |
 | 3.841 | 6.635 | 10.828 |
您最近一年使用:0次
名校
4 . 下列说法中,正确的个数为( )
①样本相关系数的绝对值大小可以反映成对样本数据之间线性相关的程度;
②用不同的模型拟合同一组数据,则残差平方和越小的模型拟合的效果越好;
③随机变量 服从正态分布
 ,若
,若 ,则
,则 ;
;
④随机变量 服从二项分布
 ,若方差
,若方差 ,则
,则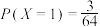 .
.
①样本相关系数
的绝对值大小可以反映成对样本数据之间线性相关的程度;②用不同的模型拟合同一组数据,则残差平方和越小的模型拟合的效果越好;
③随机变量
服从正态分布,若,则;④随机变量
服从二项分布,若方差,则.| A.1个 | B.2个 | C.3个 | D.4个 |
您最近一年使用:0次
7日内更新
|
185次组卷
|
2卷引用:天津市和平区2024届高三第三次质量调查(三模)数学试卷
名校
5 . 下列说法正确 的是( )
A.对个变量,进行线性相关检验,得线性相关系数 ,对两个变量 ,对两个变量 , , 进行线性相关检验,得线性相关系数 进行线性相关检验,得线性相关系数 ,则变量与正相关,变量与负相关,变量与的线性相关性较强 ,则变量与正相关,变量与负相关,变量与的线性相关性较强 |
B.若随机变量 服从两点分布,且 服从两点分布,且 ,则 ,则 |
C.在 的展开式中,奇数项的二项式系数和为32 的展开式中,奇数项的二项式系数和为32 |
D.已知随机变量服从正态分布 ,且 ,且 ,则 ,则 |
您最近一年使用:0次
名校
解题方法
6 . 2006年,在国家节能减排的宏观政策指导下,科技部在“十一五”启动了“863”计划新能源汽车重大项目.自2011年起,国家相关部门重点扶持新能源汽车的发展,也逐步得到消费者的认可.如下表是统计的2014年-2023年全国新能源汽车保有量(百万辆)数据:
并计算得: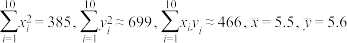 .
.
(1)根据表中数据,求相关年份与全国新能源汽车保有量的样本相关系数(精确到0.01);
(2)现苏同学购买第1辆汽车时随机在新能源汽车和非新能源汽车中选择.如果第1辆购买新能源汽车,那么第2辆仍选择购买新能源汽车的概率为0.6;如果第1辆购买非新能源汽车,那么第2辆购买新能源汽车的概率为0.8,计算苏同学第2辆购买新能源汽车的概率;
(3)某汽车网站为调查新能源汽车车主的用车体验,决定从12名候选车主中选3名车主进行访谈,已知有4名候选车主是新能源汽车车主,假设每名候选人都有相同的机会被选到,求被选到新能源汽车车主的分布列及数学期望.
附:相关系数: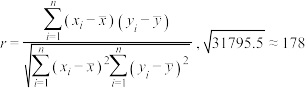 .
.
年份代码 | 1 | 2 | 3 | 4 | 5 | 6 | 7 | 8 | 9 | 10 |
年份 | 2014 | 2015 | 2016 | 2017 | 2018 | 2019 | 2020 | 2021 | 2022 | 2023 |
保有量 | 0.12 | 0.50 | 1.09 | 1.60 | 2.61 | 3.81 | 4.92 | 7.84 | 13.10 | 20.41 |
.(1)根据表中数据,求相关年份与全国新能源汽车保有量的样本相关系数(精确到0.01);
(2)现苏同学购买第1辆汽车时随机在新能源汽车和非新能源汽车中选择.如果第1辆购买新能源汽车,那么第2辆仍选择购买新能源汽车的概率为0.6;如果第1辆购买非新能源汽车,那么第2辆购买新能源汽车的概率为0.8,计算苏同学第2辆购买新能源汽车的概率;
(3)某汽车网站为调查新能源汽车车主的用车体验,决定从12名候选车主中选3名车主进行访谈,已知有4名候选车主是新能源汽车车主,假设每名候选人都有相同的机会被选到,求被选到新能源汽车车主的分布列及数学期望.
附:相关系数:
.
您最近一年使用:0次
2024-06-16更新
|
397次组卷
|
3卷引用:重庆市开州中学2023-2024学年高三下学期高考模拟考试数学试题(四)
名校
解题方法
7 . 当大气污染物 (大气中直径小于或等于
 的颗粒物)的浓度超过一定限度时会影响人的身体健康.为了了解汽车的流量与空气中的浓度之间的关系,某科研小组在某城市的一个交通点建立监测站,连续记录了十天的汽车流量(单位:千辆)和相应每天该地空气中的平均浓度(单位:
 ),得到如下数据表:
(1)求与的相关系数,并判断与之间的相关程度(精确到0.01);
(2)求关于的经验回归方程,并预测当汽车流量为2千辆时,该地空气中的平均浓度.
参考公式: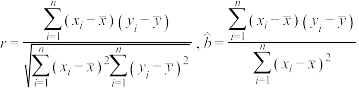 ,
, .
.
参考数据: .
.
(大气中直径小于或等于的颗粒物)的浓度超过一定限度时会影响人的身体健康.为了了解汽车的流量与空气中的浓度之间的关系,某科研小组在某城市的一个交通点建立监测站,连续记录了十天的汽车流量(单位:千辆)和相应每天该地空气中的平均浓度(单位:),得到如下数据表:汽车流量 | 1.36 | 1.63 | 1.26 | 1.86 | 0.95 | 1.18 | 1.50 | 1.05 | 1.46 | 1.75 |
| 96 | 110 | 72 | 135 | 35 | 43 | 115 | 34 | 110 | 120 |
与的相关系数,并判断与之间的相关程度(精确到0.01);(2)求
关于的经验回归方程,并预测当汽车流量为2千辆时,该地空气中的平均浓度.参考公式:
,.参考数据:
.
您最近一年使用:0次
解题方法
8 . 国家发改委和住建部等六部门发布通知,提到:2025年,农村生活垃圾无害化处理水平将明显提升,现阶段我国生活垃圾有填埋、焚烧、堆肥等三种处理方式,随着我国生态文明建设的不断深入,焚烧处理已逐渐成为主要方式,根据国家统计局公布的数据,对2013-2020年全国生活垃圾焚烧无害化处理厂的个数y(单位:座)进行统计,得到如下表格:
(1)根据表格中的数据,可用一元线性回归模型刻画变量与变量之间的线性相关关系,请用相关系数加以说明(精确到0.01);
(2)求出关于的线性回归方程(回归方程系数精确到0.01),并预测2024年全国生活垃圾焚烧无害化处理厂的个数;
(3)对于2035年全国生活垃圾焚烧无害化处理厂的个数,还能用(2)所求的线性回归方程预测吗?请简要说明理由,
参考公式:相关系数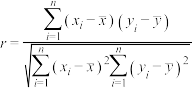
回归方程中斜率和截距的最小二乘法估计公式分别为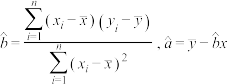
参考数据: ,
,
年份 | 2013 | 2014 | 2015 | 2016 | 2017 | 2018 | 2019 | 2020 |
年份代码 | 1 | 2 | 3 | 4 | 5 | 6 | 7 | 8 |
垃圾焚烧无害化 处理厂的个数 y | 166 | 188 | 220 | 249 | 286 | 331 | 389 | 463 |
与变量之间的线性相关关系,请用相关系数加以说明(精确到0.01);(2)求出
关于的线性回归方程(回归方程系数精确到0.01),并预测2024年全国生活垃圾焚烧无害化处理厂的个数;(3)对于2035年全国生活垃圾焚烧无害化处理厂的个数,还能用(2)所求的线性回归方程预测吗?请简要说明理由,
参考公式:相关系数
回归方程
中斜率和截距的最小二乘法估计公式分别为 参考数据:
,
您最近一年使用:0次
2024-06-14更新
|
79次组卷
|
2卷引用:陕西省洛南中学2024届高三第十次模拟考试理科数学试题
名校
9 . 某市联考后从全体考生中随机抽取42名,获取他们本次考试的数学成绩 和物理成绩
和物理成绩 ,绘制成如图散点图:与之间有线性相关关系,但图中有两个异常点
 .经调查得知,
 考生由于重感冒导致物理考试发挥失常,
 考生因故未能参加物理考试.为了使分析结果更科学准确,剔除这两组数据后,对剩下的数据作处理,得到一些统计的值:
 ,其中,
,其中,
分别表示这40名同学的数学成绩、物理成绩, 与的相关系数
 .
.
(1)若不剔除两名考生的数据,用42组数据作回归分析,设此时与的相关系数为 .试判断与的大小关系,并说明理由;
(2)求关于的线性回归方程,并估计如果考生参加了这次物理考试(已知考生的数学成绩为126分),物理成绩是多少?
(3)从概率统计规律看,本次考试该市的物理成绩服从正态分布 ,以剔除后的物理成绩作为样本,用样本平均数
 作为
作为 的估计值,用样本方差
 作为
作为 的估计值.试求该市共40000名考生中,物理成绩位于区间
 的人数
的人数 的数学期望.
附:①回归方程 中:
中:
②若 ,则
,则
③
和物理成绩,绘制成如图散点图:
与之间有线性相关关系,但图中有两个异常点.经调查得知,考生由于重感冒导致物理考试发挥失常,考生因故未能参加物理考试.为了使分析结果更科学准确,剔除这两组数据后,对剩下的数据作处理,得到一些统计的值:,其中,分别表示这40名同学的数学成绩、物理成绩,与的相关系数.(1)若不剔除
两名考生的数据,用42组数据作回归分析,设此时与的相关系数为.试判断与的大小关系,并说明理由;(2)求
关于的线性回归方程,并估计如果考生参加了这次物理考试(已知考生的数学成绩为126分),物理成绩是多少?(3)从概率统计规律看,本次考试该市的物理成绩
服从正态分布,以剔除后的物理成绩作为样本,用样本平均数作为的估计值,用样本方差作为的估计值.试求该市共40000名考生中,物理成绩位于区间的人数的数学期望.附:①回归方程
中:②若
,则③
您最近一年使用:0次
名校
10 . 2023年,我国新能源汽车产销量占全球比重超过 ,中国成为世界第一大汽车出口国. 某汽车城统计新能源汽车从某天开始连续的营业天数与销售总量(单位:辆),采集了一组共20对数据,并计算得到回归方程
 ,且这组数据中,连续的营业天数的方差
 ,销售总量的方差
 .
.
(1)求样本相关系数,并说明与的相关性;
(2)在这组数据中,若连续的营业天数满足 ,试推算销售总量的平均数.
附:经验回归方程,其中 ,.
,.
样本相关系数, .
.
,中国成为世界第一大汽车出口国. 某汽车城统计新能源汽车从某天开始连续的营业天数与销售总量(单位:辆),采集了一组共20对数据,并计算得到回归方程,且这组数据中,连续的营业天数的方差,销售总量的方差.(1)求样本相关系数
,并说明与的相关性;(2)在这组数据中,若连续的营业天数
满足,试推算销售总量的平均数.附:经验回归方程
,其中,.样本相关系数
,.
您最近一年使用:0次


