解题方法
1 . 某纺织厂为了生产一种高端布料,准备从A农场购进一批优质棉花,厂方技术员从A农场存储的优质棉花中随机抽取了100处棉花,分别测量了其纤维长度(单位:mm)的均值,收集到100个样本数据,并制成如下频数分布表:
长度(单位:mm) | [23,25) | [25,27) | [27,29) | [29,31) | [31,33) | [33,35) | [35,37) | [37,39] |
频数 | 4 | 9 | 16 | 24 | 18 | 14 | 10 | 5 |
(1)求这100个样本数据的平均数
 和样本方差
和样本方差 (同一组数据用该区间的中点值作代表);
(2)将收集到的数据绘成直方图可以认为这批棉花的纤维长度服从分布
 其中
其中 ,
,
①利用正态分布,求 ;
;
②纺织厂将A农场送来的这批优质棉进行二次检验,从中随机抽取20处测量其纤维均值yi(i=1,2…,20),数据如下:
y1 | y2 | y3 | y4 | y5 | y6 | y7 | y8 | y9 | y10 |
24.1 | 31.8 | 32.7 | 28.2 | 28.4 | 34.3 | 29.1 | 34.8 | 37.2 | 30.8 |
y11 | y12 | y13 | y14 | y15 | y16 | y17 | y18 | y19 | y20 |
30.6 | 25.2 | 32.9 | 27.1 | 35.9 | 28.9 | 33.9 | 29.5 | 35.0 | 29.9 |
若20个样本中纤维均值 的频率不低于①中即可判断该批优质棉花合格,否则认为农场运送时掺杂了次品,判断该批棉花不合格.按照此依据判断A农场送来的这批棉花是否为合格的优质棉花,并说明理由.
附:若 ,则
,则 ,
, ,
,
您最近一年使用:0次
真题
解题方法
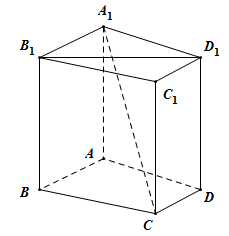
2 . 如图所示,在直四棱柱 中,当底面四边形ABCD满足条件
您最近一年使用:0次
2017-11-27更新
|
950次组卷
|
16卷引用:2014-2015学年山西省右玉一中高二上学期第一次月考数学试卷
2014-2015学年山西省右玉一中高二上学期第一次月考数学试卷2016-2017学年江苏徐州睢宁县古邳中学高二上第一次月考数学试卷(已下线)同步君人教A版选修1-2第二章2.2.1综合法和分析法(已下线)同步君人教A版选修2-2第二章2.2.1综合法和分析人教A版高中数学必修二第二章 章末检测卷高中数学人教版 选修1-2(文科) 第二章 推理与证明 2.2.1 综合法和分析法高中数学人教版 选修2-2(理科) 第二章推理与证明 2.2.1综合法和分析法(已下线)第02章 章末检测(A)-2018-2019版数学创新设计课堂讲义同步系列(人教A版必修2)(已下线)章末检测2(课后作业)-2018-2019版数学创新设计课堂讲义同步系列(人教A版必修2)(已下线)第01章 立体几何初步(A)-2018-2019版数学创新设计课堂讲义同步系列(北师大版必修2)(已下线)第01章 章末检测-2018-2019版数学创新设计课堂讲义同步系列(苏教版必修2)上海市鲁迅中学2019-2020学年高三上学期9月月考数学试题(已下线)8.6.2 第2课时 直线与平面垂直的性质(课时作业)-2021-2022学年高一数学同步精品课件+课时作业(人教A版2019必修第二册)1998年普通高等学校招生考试数学(理)试题(全国卷)1998年普通高等学校招生考试数学(文)试题(全国卷)(已下线)8.6.2 直线与平面垂直【第三课】“上好三节课,做好三套题“高中数学素养晋级之路
名校
3 . 某剧场的座位数量是固定的,管理人员统计了最近在该剧场举办的五场表演的票价 (单位:元)和上座率
 (上座人数与总座位数的比值)的数据,其中
 ,并根据统计数据得到如下的散点图:

(1)由散点图判断
 与
与 哪个模型能更好地对
 与
与 的关系进行拟合(给出判断即可,不必说明理由),并根据你的判断结果求回归方程;
(2)根据(1)所求的回归方程,预测票价为多少时,剧场的门票收入最多.
参考数据: ,
, ,
, ;设
;设 ,则
,则 ,
, ,
, ;
; ,
, ,
, .
.
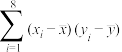
参考公式:对于一组数据 ,其回归直线
 的斜率和截距的最小二乘估计分别为:
 ,
, .
.
您最近一年使用:0次
2023-03-27更新
|
1670次组卷
|
10卷引用:天一大联考(山西省)三晋名校联盟2022-2023学年高三下学期顶尖计划联考数学试题
天一大联考(山西省)三晋名校联盟2022-2023学年高三下学期顶尖计划联考数学试题(已下线)第76练 计算提升训练16河南省实验中学2023届高三模拟考试四文科数学试题(已下线)8.2 一元线性回归模型及其应用 -【帮课堂】2022-2023学年高二数学同步精品讲义(人教A版2019选择性必修第三册)湖南省永州市第一中学2024届高三上学期第一次月考数学试题(已下线)第二章 函数的概念与性质 第八节 对数函数理科数学-【名校面对面】河南省三甲名校2023届高三校内模拟试题(六)文科数学-【名校面对面】河南省三甲名校2023届高三校内模拟试题(四)(已下线)第5讲:成对数据的统计分析(非线性回归)【练】(已下线)第04讲 拓展一:数学建模 建立统计模型进行预测(非线性回归模型)-【帮课堂】2023-2024学年高二数学同步学与练(人教A版2019选择性必修第三册)
名校
解题方法
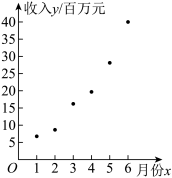
4 . 随着全球新能源汽车市场蓬勃增长,在政策推动下,中国新能源汽车企业在10余年间实现了“弯道超车”,一跃成为新能源汽车产量连续7年居世界第一的全球新能源汽车强国.某新能源汽车企业基于领先技术的支持,改进并生产纯电动车、插电混合式电动车、氢燃料电池车三种车型,生产效益在短期内逐月攀升,该企业在1月份至6月份的生产利润y(单位,百万元)关于月份的数据如下表所示,并根据数据绘制了如图所示的散点图.
(1)根据散点图判断, 与
与 (
( ,
, ,
, ,d均为常数)哪一个更适宜作为利润关于月份的回归方程类型?(给出判断即可,不必说明理由)
(2)根据(1)的结果及表中的数据,求出y关于的回归方程;
(3)该车企为提高新能源汽车的安全性,近期配合中国汽车技术研究中心进行了包括跌落、追尾、多车碰撞等一系列安全试验项目,其中在实验场进行了一项甲、乙、丙三车同时去碰撞实验车的多车碰撞实验,测得实验车报废的概率为0.188,并且当只有一车碰撞实验车发生,实验车报废的概率为0.1,当有两车碰撞实验车发生,实验车报废的概率为0.2,由于各种因素,实验中甲乙丙三车碰撞实验车发生概率分别为0.7,0.5,0.4,且互不影响,求当三车同时碰撞实验车发生时实验车报废的概率.
参考数据:
其中,设 ,
, .
.
参考公式:对于一组具有线性相关关系的数据 ,其回归直线
 的斜率和截距的最小二乘估计公式分别为
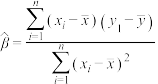 ,
, .
.
的数据如下表所示,并根据数据绘制了如图所示的散点图.| 月份 | 1 | 2 | 3 | 4 | 5 | 6 |
| 收入(百万元) | 6.8 | 8.6 | 16.1 | 19.6 | 28.1 | 40.0 |
(1)根据散点图判断,
与(,,,d均为常数)哪一个更适宜作为利润关于月份的回归方程类型?(给出判断即可,不必说明理由)(2)根据(1)的结果及表中的数据,求出y关于
的回归方程;(3)该车企为提高新能源汽车的安全性,近期配合中国汽车技术研究中心进行了包括跌落、追尾、多车碰撞等一系列安全试验项目,其中在实验场进行了一项甲、乙、丙三车同时去碰撞实验车的多车碰撞实验,测得实验车报废的概率为0.188,并且当只有一车碰撞实验车发生,实验车报废的概率为0.1,当有两车碰撞实验车发生,实验车报废的概率为0.2,由于各种因素,实验中甲乙丙三车碰撞实验车发生概率分别为0.7,0.5,0.4,且互不影响,求当三车同时碰撞实验车发生时实验车报废的概率.
参考数据:
 |  |  | 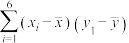 |  |
| 19.87 | 2.80 | 17.50 | 113.75 | 6.30 |
,.参考公式:对于一组具有线性相关关系的数据
,其回归直线的斜率和截距的最小二乘估计公式分别为,.
您最近一年使用:0次
2023-05-03更新
|
2698次组卷
|
7卷引用:山西省运城市康杰中学2022-2023学年高二下学期第二次月考数学试题
山西省运城市康杰中学2022-2023学年高二下学期第二次月考数学试题河北省2023届高三适应性考试数学试题广东省广州市第六中学2023届高三三模数学试题(已下线)第9章:统计 重点题型复习-【题型分类归纳】2022-2023学年高二数学同步讲与练(苏教版2019选择性必修第二册)(已下线)4.2 一元线性回归模型(同步练习)-【素养提升—课时练】2022-2023学年高二数学湘教版选择性必修第二册检测 (提高篇)(已下线)第十章 重难专攻(十三) 概率与统计的综合问题(讲)(已下线)第5讲:成对数据的统计分析(非线性回归)【练】
解题方法
5 . 对于一个函数 ,若存在两条距离为
 的直线
的直线 和
和 ,使得
,使得 在
在 时恒成立,称函数
 在
在 内有一个宽度为的通道.则下列函数在
 内有一个宽度为1的通道的有
______ .(填序号即可)
① ;
;
② ;
;
③ ;
;
④ .
.
,若存在两条距离为的直线和,使得在时恒成立,称函数在内有一个宽度为的通道.则下列函数在内有一个宽度为1的通道的有①
;②
;③
;④
.
您最近一年使用:0次
9-10高三·辽宁丹东·阶段练习
名校
6 . 某单位举办2020年杭州亚运会知识宣传活动,进行现场抽奖,盒中装有9张大小相同的精美卡片,卡片上分别印有“亚运会会徽”或“五环”图案;抽奖规则是:参加者从盒中抽取卡片两张,若抽到两张都是“五环”卡即可获奖,否则,均为不获奖.卡片用后放回盒子,下一位参加者继续重复进行.
(Ⅰ)活动开始后,一位参加者问:盒中有几张“五环”卡?主持人答:我只知道,从盒中抽取两张都是“会徽”卡的概率是 ,求抽奖者获奖的概率;
(Ⅱ)现有甲、乙、丙、丁四人依次抽奖,用 表示获奖的人数,求的分布列及
 的值.
的值.
(Ⅰ)活动开始后,一位参加者问:盒中有几张“五环”卡?主持人答:我只知道,从盒中抽取两张都是“会徽”卡的概率是
,求抽奖者获奖的概率;(Ⅱ)现有甲、乙、丙、丁四人依次抽奖,用
表示获奖的人数,求的分布列及的值.
您最近一年使用:0次
2019-06-14更新
|
2506次组卷
|
11卷引用:山西省大同市第一中学2020届高三下学期2月模拟二数学(理)试题
山西省大同市第一中学2020届高三下学期2月模拟二数学(理)试题(已下线)2011届辽宁省丹东市四校协作体高三第一次联合考试理科数学卷(已下线)2011届浙江省杭州市萧山九中高三寒假作业数学卷二【省级联考】浙江省2019届高三高考全真模拟(二)数学试题(已下线)专题10.7 离散型随机变量的均值与方差(讲)-浙江版《2020年高考一轮复习讲练测》(已下线)专题04 二项分布与超几何分布(第四篇)-备战2020年高考数学大题精做之解答题题型全覆盖(已下线)4.2.3 二项分布与超几何分布-2020-2021学年高二数学课时同步练(人教B版2019选择性必修第二册)(已下线)专题7.4二项分布与超几何分布(A卷基础篇)-2020-2021学年高二下学期数学选择性必修第三册同步单元AB卷(新教材人教A版,浙江专用)(已下线)专题4期望与方差运算(基础版)黑龙江省肇东市第四中学2021-2022学年高二下学期期末考试数学试题广东省茂名市高州中学2023-2024学年高二上学期期中数学试题(1-3班)
7 . 某公司为确定下一年度投入某种产品的宣传费,需了解年宣传费x(单位:千元)对年销售量y(单位:t)和年利润z(单位:千元)的影响,对近8年的年宣传费和年销售量( =1,2,···,8)数据作了初步处理,得到下面的散点图及一些统计量的值.
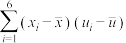
表中 ,
, =
=

(Ⅰ)根据散点图判断,y=a+bx与y=c+d 哪一个适宜作为年销售量y关于年宣传费x的回归方程类型?(给出判断即可,不必说明理由)
(Ⅱ)根据(Ⅰ)的判断结果及表中数据,建立y关于x的回归方程;
(Ⅲ)已知这种产品的年利润z与x、y的关系为z=0.2y-x.根据(Ⅱ)的结果回答下列问题:
(ⅰ)年宣传费x=49时,年销售量及年利润的预报值是多少?
(ⅱ)年宣传费x为何值时,年利润的预报值最大?
和年销售量(=1,2,···,8)数据作了初步处理,得到下面的散点图及一些统计量的值.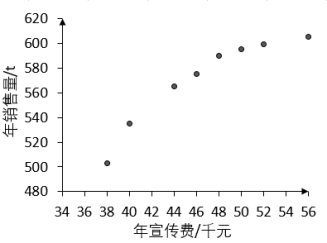
  | |  |  |  |  |  |
| 46.6 | 563 | 6.8 | 289.8 | 1.6 | 1469 | 108.8 |
,=(Ⅰ)根据散点图判断,y=a+bx与y=c+d
哪一个适宜作为年销售量y关于年宣传费x的回归方程类型?(给出判断即可,不必说明理由)(Ⅱ)根据(Ⅰ)的判断结果及表中数据,建立y关于x的回归方程;
(Ⅲ)已知这种产品的年利润z与x、y的关系为z=0.2y-x.根据(Ⅱ)的结果回答下列问题:
(ⅰ)年宣传费x=49时,年销售量及年利润的预报值是多少?
(ⅱ)年宣传费x为何值时,年利润的预报值最大?
附:对于一组数据 ,
, ,……,
,……, ,其回归线
,其回归线 的斜率和截距的最小二乘估计分别为:
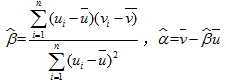
您最近一年使用:0次
2019-01-30更新
|
21993次组卷
|
59卷引用:山西实验中学、南海桂城中学2018届高三上学期联考理数试题
山西实验中学、南海桂城中学2018届高三上学期联考理数试题山西实验中学、南海桂城中学2018届高三上学期联考数学(文)试题2015年全国普通高等学校招生统一考试理科数学(新课标Ⅰ)2015年全国普通高等学校招生统一考试文科数学(新课标Ⅰ)河南省南阳市六校2016-2017学年高二下学期第二次联考数学(文)试题河南省南阳六校2016-2017高二月考联考文科数学试题湖南省永州市祁阳县第一中学2018届高三10月月考数学(文)试题(已下线)黄金30题系列 高三年级数学(文) 大题易丢分高中数学人教A版选修2-3 第三章 统计案例 本章复习与测试(已下线)《考前20天终极攻略》5月31日 统计【理科】(已下线)高中数学新教材练习题【校级联考】江西省南昌市八一中学、洪都中学、麻丘高中等七校2018-2019学年高二下学期期中考试数学(文)试题安徽省蚌埠市第二中学2016-2017学年高二下学期期中考试数学(文)试题【全国百强校】福建省尤溪一中2018-2019学年高二第二学期期中考试数学(文科)试题新疆阿克苏市高级中学2018-2019学年高二下学期期末考试数学(理)试题(已下线)7.概率与统计[文] -《备战2020年高考精选考点专项突破题集》2020届湖南省长沙市雅礼中学高三上学期第2次月考数学(文)试题专题07 概率与统计[理]-《备战2020年高考精选考点专项突破题集》(已下线)专题02 变量间的相关关系与回归分析(第四篇)-备战2020年高考数学大题精做之解答题题型全覆盖江苏省南京市江宁高级中学2019-2020学年高二下学期期中数学试题河南省新安县第一高级中学2019-2020学年高二5月月考数学(文)试题(已下线)文科数学-6月大数据精选模拟卷05(新课标Ⅱ卷)(满分冲刺篇)河南省开封市2020届高三第三次模拟考试数学(文科)试题2020年普通高等学校招生全国统一考试 文科数学样卷(十二)安徽省蚌埠市第二中学2019-2020学年高二下学期期中文科数学试题(已下线)突破3.1回归分析的基本思想及其初步应用突破满分数学之2019-2020学年高二数学(理)课时训练(人教A版选修2-3)(已下线)突破3.1回归分析的基本思想及其初步应用-突破满分数学之2019-2020学年高二数学(理)重难点突破(人教A版选修2-3)(已下线)重难点02回归方程重难点考与题型突破突破满分数学之2019-2020学年高二数学(理)重难点突破(人教A版选修2-3)(已下线)专题32 概率和统计【理】-十年(2011-2020)高考真题数学分项(二)江西省景德镇一中2020-2021学年高二(2班)上学期期中考试数学试题(已下线)考点43 变量间的相关关系-备战2021年高考数学(文)一轮复习考点一遍过(已下线)考点45 变量间的相关关系-备战2021年高考数学(理)一轮复习考点一遍过(已下线)解密08 统计与统计案例(讲义)-【高频考点解密】2021年新高考数学二轮复习讲义+分层训练(已下线)专题14 概率统计-十年(2012-2021)高考数学真题分项汇编(全国通用)(已下线)第四章 概率与统计 本章小结陕西省西安中学2021-2022学年高三上学期期中文科数学试题安徽省黄山市屯溪第一中学2019-2020学年高二下学期入学考试数学(文)试题2019届湖南省长沙市宁乡一中高三下学期5月仿真考试数学(理)试题(已下线)考向51 变量间的相关关系、统计案例-备战2022年高考数学一轮复习考点微专题(新高考地区专用)(已下线)专题15 概率统计及其应用(讲)--第一篇 热点、难点突破篇-《2022年高考数学二轮复习讲练测(新高考·全国卷)》人教A版(2019) 选修第三册 核心素养 6-8章 阶段检测卷(已下线)专题51 盘点统计初步及独立性检验问题——备战2022年高考数学二轮复习常考点专题突破人教A版(2019) 选修第三册 一蹴而就 第八章 单元整合(已下线)2022年高考考前20天终极冲刺攻略(四)【理科数学】(6月2日)(已下线)文科数学-2022年高考押题预测卷01(全国乙卷)全国西北工业大学附属中学2021-2022学年高二下学期期末数学试题(已下线)第08讲 成对数据的统计分析(核心考点讲与练)-2021-2022学年高二数学下学期考试满分全攻略(人教A版2019选修第二册+第三册)辽宁省大连市2021-2022学年高二下学期期末数学试题(已下线)专题13 概率统计解答题(已下线)专题14 概率统计解答题-2陕西省延安市第一中学2021-2022学年高二下学期期中文科数学试题福建省福州市屏东中学2023届高三上学期10月第一次月考数学试题(已下线)14.2 统计模型(已下线)专题11-1 直方图、回归方程(线性与非线性)-1四川省宜宾市第六中学校2022-2023学年高二下学期3月月考数学试题(文)广西柳州市第三中学2023届高三下学期2月开学考数学(文)试题(已下线)统 计专题32概率统计解答题(第一部分)专题33概率统计解答题(第一部分)
2020高三·全国·专题练习
名校
解题方法
8 .  年春节联欢晚会以“共圆小康梦、欢乐过大年”为主题,突出时代性、人民性、创新性,节目内容丰富多彩,呈现形式新颖多样.某小区的
 个家庭买了
个家庭买了 张连号的门票,其中甲家庭需要
 张连号的门票,乙家庭需要
 张连号的门票,剩余的张随机分到剩余的个家庭即可,则这张门票不同的分配方法的种数为( )
年春节联欢晚会以“共圆小康梦、欢乐过大年”为主题,突出时代性、人民性、创新性,节目内容丰富多彩,呈现形式新颖多样.某小区的个家庭买了张连号的门票,其中甲家庭需要张连号的门票,乙家庭需要张连号的门票,剩余的张随机分到剩余的个家庭即可,则这张门票不同的分配方法的种数为( )A. |
B. |
C. |
D. |
您最近一年使用:0次
2021-01-16更新
|
2244次组卷
|
11卷引用:山西省太原市2023届高三上学期1月第一次联考数学试题
山西省太原市2023届高三上学期1月第一次联考数学试题山西省山西大学附属中学校2023届高三下学期5月月考数学试题(已下线)专题61 统计与概率综合练习-2021年高考一轮数学单元复习一遍过(新高考地区专用)(已下线)专题61 统计与概率综合练习-2021年高考一轮数学(理)单元复习一遍过北京市日坛中学2020-2021学年高二下学期期中考试数学试题山东省(新高考)2021届高三模拟冲关押题卷(二)数学试题人教B版(2019) 选修第二册 名师精选 第三章 排列、组合与二项式定理苏教版(2019) 选修第二册 名师精选 第七章 计数原理(已下线)第十二章 统计与概率专练2—排列组合2-2022届高三数学一轮复习重庆市第八中学校2021-2022学年高二下学期6月月考数学试题湖南省娄底市部分学校2023届高三三模数学试题
9 . 某学生社团有男生32名,女生24名,从中随机抽取一个容量为7的样本,某次抽样结果为:抽到3名男生和4名女生,则下列说法正确的是( )
| A.这次抽样可能采用的是抽签法 |
| B.这次抽样不可能是按性别分层随机抽样 |
| C.这次抽样中,每个男生被抽到的概率一定小于每个女生被抽到的概率 |
| D.这次抽样中,每个男生被抽到的概率不可能等于每个女生被抽到的概率 |
您最近一年使用:0次
2023-02-17更新
|
645次组卷
|
7卷引用:山西省临汾市2023届高三下学期第一次高考考前适应性训练数学试题
山西省临汾市2023届高三下学期第一次高考考前适应性训练数学试题(已下线)9.1.2分层随机抽样(已下线)9.1 随机抽样(分层练习)(已下线)专题9.6 统计全章综合测试卷(基础篇)-2022-2023学年高一数学举一反三系列(人教A版2019必修第二册)(已下线)14.1-14.2 获取数据的基本途径、抽样 (2) -《考点·题型·技巧》广西百色市2022-2023学年高一下学期数学期末复习预测试题新疆维吾尔自治区昌吉回族自治州呼图壁县第一中学2023-2024学年高二上学期期初模块测试数学试题
10 . 用一个平面去截如图所示的圆柱体,则所得的截面不可能是( )
A. | B. | C. | D. |
您最近一年使用:0次
2019-11-28更新
|
396次组卷
|
3卷引用:山西省太原市2019-2020学年高二上学期期中数学试题


