名校
1 .  市某企业坚持以市场需求为导向,合理配置生产资源,不断改革、探索销售模式.下表是该企业每月生产的一种核心产品的产量
 (吨)与相应的生产总成本
 (万元)的五组对照数据.
(Ⅰ)根据上述数据,若用最小二乘法进行线性模拟,试求关于的线性回归直线方程 ;
;
参考公式: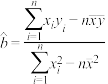 ,
, .
.
(Ⅱ)记第(Ⅰ)问中所求与的线性回归直线方程为模型①,同时该企业科研人员利用计算机根据数据又建立了与的回归模型②: .其中模型②的残差图(残差
 实际值
实际值 预报值)如图所示:
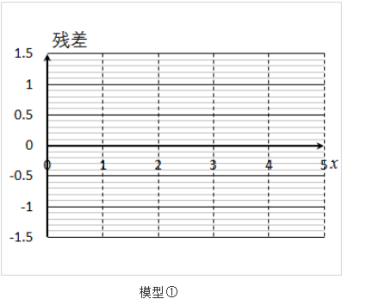
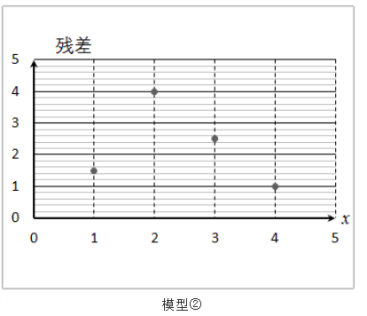
请完成模型①的残差表(见答题卡)与残差图,并根据残差图,判断哪一个模型更适宜作为关于的回归方程?并说明理由;
(Ⅲ)研究人员统计历年的销售数据,得到每吨产品的销售价格 (万元)是一个与月产量相关的随机变量,其分布列为:
结合你对(Ⅱ)的判断,当月产量为何值时,月利润的预报期望值最大?
市某企业坚持以市场需求为导向,合理配置生产资源,不断改革、探索销售模式.下表是该企业每月生产的一种核心产品的产量(吨)与相应的生产总成本(万元)的五组对照数据.产量 | 1 | 2 | 3 | 4 | 5 |
生产总成本 | 3 | 7 | 8 | 10 | 12 |
(Ⅰ)根据上述数据,若用最小二乘法进行线性模拟,试求
关于的线性回归直线方程;参考公式:
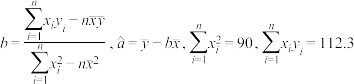
,.(Ⅱ)记第(Ⅰ)问中所求
与的线性回归直线方程为模型①,同时该企业科研人员利用计算机根据数据又建立了与的回归模型②:.其中模型②的残差图(残差实际值预报值)如图所示:请完成模型①的残差表(见答题卡)与残差图,并根据残差图,判断哪一个模型更适宜作为
关于的回归方程?并说明理由;(Ⅲ)研究人员统计历年的销售数据,得到每吨产品的销售价格
(万元)是一个与月产量相关的随机变量,其分布列为:
|
|
|
|
| 0.5 | 0.3 | 0.2 |


结合你对(Ⅱ)的判断,当月产量
为何值时,月利润的预报期望值最大?
您最近一年使用:0次
2020-07-22更新
|
437次组卷
|
2卷引用:黑龙江省哈尔滨师范大学附属中学2020届高三下学期第四次模拟数学理科试题
2 . 假设关于某设备的使用年限x和支出的维修费y(万元)有如下表的统计资料
(1)画出数据的散点图,并判断y与x是否呈线性相关关系
(2)若y与x呈线性相关关系,求线性回归方程 的回归系数
的回归系数 ,
,
(3)估计使用年限为10年时,维修费用是多少?
参考公式及相关数据:
| 使用年限x | 2 | 3 | 4 | 5 | 6 |
| 维修费用y | 2.2 | 3.8 | 5.5 | 6.5 | 7.0 |
(1)画出数据的散点图,并判断y与x是否呈线性相关关系
(2)若y与x呈线性相关关系,求线性回归方程
的回归系数,(3)估计使用年限为10年时,维修费用是多少?
参考公式及相关数据:
您最近一年使用:0次
2019-09-15更新
|
625次组卷
|
3卷引用:甘肃省金昌市永昌四中2018-2019学年高二下学期期中考试数学(文)试题
11-12高二下·黑龙江鸡西·期中
名校
3 . 某车间为了规定工时定额,需要确定加工零件所花费的时间,为此作了四次试验,得到的数据如下:
(1)在给定的坐标系中画出表中数据的散点图;
(2)求出y关于x的线性回归方程,并在坐标系中画出回归直线;
(3)试预测加工10个零件需要多少时间?
(注: )
)
| 零件的个数x(个) | 2 | 3 | 4 | 5 |
| 加工的时间y(小时) | 2.5 | 3 | 4 | 4.5 |
(2)求出y关于x的线性回归方程
,并在坐标系中画出回归直线;(3)试预测加工10个零件需要多少时间?
(注:
)
您最近一年使用:0次
2017-05-16更新
|
1668次组卷
|
5卷引用:2011—2012学年黑龙江虎林高中高二下学期期中理科数学试卷
2020高三·全国·专题练习
名校
解题方法
4 . 一台机器由于使用时间较长,生产的零件有一些会缺损,按不同转速生产出来的零件有缺损的统计数据如下表:
(1)作出散点图;
(2)如果y与x线性相关,求出回归直线方程;
(3)若实际生产中,允许每小时生产的产品中有缺损的零件最多为10个,机器的转速应控制在什么范围内?(结果保留整数)
附:线性回归方程 中,
中, ,其中
,其中 为样本平均值.
转速x(转/秒) | 16 | 14 | 12 | 8 |
每小时生产缺损零件数y(件) | 11 | 9 | 8 | 5 |
(2)如果y与x线性相关,求出回归直线方程;
(3)若实际生产中,允许每小时生产的产品中有缺损的零件最多为10个,机器的转速应控制在什么范围内?(结果保留整数)
附:线性回归方程
中,,其中为样本平均值.
您最近一年使用:0次
2021-01-26更新
|
310次组卷
|
4卷引用:专题54 统计与概率(同步练习)-2021年高考一轮数学(文)单元复习一遍过
(已下线)专题54 统计与概率(同步练习)-2021年高考一轮数学(文)单元复习一遍过(已下线)专题60 统计与概率(同步练习)-2021年高考一轮数学(理)单元复习一遍过宁夏银川一中2020-2021学年高二上学期期末考试数学(文)试题河北省张家口市第一中学(普实班)2020-2021学年高二下学期期中数学试题
名校
解题方法
5 . 下表提供了某厂节能降耗技术改造后生产甲产品过程中记录的产量(吨)与相应的生产能耗(吨)标准煤的几组对照数据:
(1)请画出上表数据的散点图;
(2)请根据上表提供的数据,用最小二乘法求出关于的线性回归方程 ;
;
(3)已知该厂技术改造前100吨甲产品能耗为200吨标准煤,试根据(2)求出的线性回归方程,预测生产100吨甲产品的生产能耗比技术改造前降低多少吨标准煤?
吨)与相应的生产能耗(吨)标准煤的几组对照数据:
| 1 | 2 | 3 | 4 | 5 |
| 2 | 3 | 6 | 9 | 10 |
(2)请根据上表提供的数据,用最小二乘法求出
关于的线性回归方程; (3)已知该厂技术改造前100吨甲产品能耗为200吨标准煤,试根据(2)求出的线性回归方程,预测生产100吨甲产品的生产能耗比技术改造前降低多少吨标准煤?
您最近一年使用:0次
名校
6 . 随着人们经济收入的不断增长,个人购买家庭轿车已不再是一种时尚车的使用费用,尤其是随着使用年限的增多,所支出的费用到底会增长多少,一直是购车一族非常关心的问题某汽车销售公司作了一次抽样调查,并统计得出某款车的使用年限与所支出的总费用(万元)有如表的数据资料:
(1) 在给出的坐标系中作出散点图;
(2)求线性回归方程 中的
中的 、
、 ;
;
(3)估计使用年限为 年时,车的使用总费用是多少?
(最小二乘法求线性回归方程系数公式 ,
,  .)
.)
与所支出的总费用(万元)有如表的数据资料:| 使用年限 | 2 | 3 | 4 | 5 | 6 |
| 总费用 | 2.2 | 3.8 | 5.5 | 6.5 | 7.0 |
(1) 在给出的坐标系中作出散点图;
(2)求线性回归方程
中的、;(3)估计使用年限为
年时,车的使用总费用是多少?(最小二乘法求线性回归方程系数公式
, .)
您最近一年使用:0次
2019-04-28更新
|
548次组卷
|
6卷引用:【全国百强校】广东省佛山市第一中学2018-2019学年高二下学期第一次月考数学(文)试题
名校
解题方法
7 . 某个服装店经营某种服装,在某周内每天获得的纯利润 (元)与该周每天销售这种服装数量
 (件)之间的一组数据关系如下表:
已知: ,
, ,
, .
.
参考公式:线性回归方程是 ,其中
,其中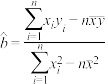 ,
, .
.
(1)求 ,
, ;
;
(2)画出散点图;
(3)求每天的纯利润与每天销售数量之间的线性回归方程.
(元)与该周每天销售这种服装数量(件)之间的一组数据关系如下表: | 3 | 4 | 5 | 6 | 7 | 8 | 9 |
| 66 | 69 | 73 | 81 | 89 | 90 | 91 |
,,.参考公式:线性回归方程是
,其中,.(1)求
,;(2)画出散点图;
(3)求每天的纯利润
与每天销售数量之间的线性回归方程.
您最近一年使用:0次
2021-09-22更新
|
279次组卷
|
5卷引用:2015-2016学年山西怀仁一中高一下第一次月考理科数学卷
8 . 假设关于某设备的使用年限(年)和所支出的年平均维修费用(万元)(即维修费用之和除以使用年限),有如下的统计资料:
(1)画出散点图;
(2)从散点图中发现使用年限与所支出的年平均维修费用之间关系的一般规律;
(3)求关于的线性回归方程;
(4)估计使用年限为10年时所支出的年平均维修费用是多少?
(年)和所支出的年平均维修费用(万元)(即维修费用之和除以使用年限),有如下的统计资料:| 使用年限 | 2 | 3 | 4 | 5 | 6 |
| 维修费用 | 2.2 | 3.8 | 5.5 | 6.5 | 7.0 |
(2)从散点图中发现使用年限与所支出的年平均维修费用之间关系的一般规律;
(3)求
关于的线性回归方程;(4)估计使用年限为10年时所支出的年平均维修费用是多少?
您最近一年使用:0次
名校
解题方法
9 . 某车间为了规定工时定额,需要确定加工零件所花费的时间,为此做了四次试验,得到的数据如表:
(1)在给定的坐标系中画出表中数据的散点图.
(2)求出y关于x的线性回归方程,试预测加工10个零件需要多少小时?
(注: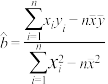 ,
, )
)
| 零件的个数x(个) | 2 | 3 | 4 | 5 |
| 加工的时间y(小时) | 2.5 | 3 | 4 | 4.5 |
(1)在给定的坐标系中画出表中数据的散点图.
(2)求出y关于x的线性回归方程
,试预测加工10个零件需要多少小时?(注:
,)
您最近一年使用:0次
2020-06-16更新
|
387次组卷
|
4卷引用:广西天等中学2019-2020学年高二上学期期中考试数学文科试题
解题方法
10 . 下表数据是水的温度x(℃)对黄酮延长性y(%)效应的试验结果,y是以延长度计算的.
(1)画出散点图;
(2)指出x,y是否线性相关,若线性相关,求y关于x的回归方程;
(3)估计水的温度是1000 ℃时,黄酮延长性的情况.
| x/℃ | 300 | 400 | 500 | 600 | 700 | 800 |
| y/% | 40 | 50 | 55 | 60 | 67 | 70 |
(2)指出x,y是否线性相关,若线性相关,求y关于x的回归方程;
(3)估计水的温度是1000 ℃时,黄酮延长性的情况.
您最近一年使用:0次


