名校
解题方法
1 . 某化工厂引进一条先进生产线生产某种化工产品,其生产的总成本 万元与年产量
 吨之间的函数关系可以近似地表示为
 ,已知此生产线的年产量最小为60吨,最大为110吨.
(1)年产量为多少吨时,生产每吨产品的平均成本最低?并求最低平均成本;
(2)若每吨产品的平均出厂价为24万元,且产品能全部售出,则年产量为多少吨时,可以获得最大利润?并求最大利润.
万元与年产量吨之间的函数关系可以近似地表示为,已知此生产线的年产量最小为60吨,最大为110吨.(1)年产量为多少吨时,生产每吨产品的平均成本最低?并求最低平均成本;
(2)若每吨产品的平均出厂价为24万元,且产品能全部售出,则年产量为多少吨时,可以获得最大利润?并求最大利润.
您最近一年使用:0次
2021-07-08更新
|
5003次组卷
|
27卷引用:四川省成都市石室中学2022-2023学年高一上学期第二次质量检测数学理科试题
四川省成都市石室中学2022-2023学年高一上学期第二次质量检测数学理科试题2021年江苏省普通高考对口单招文化统考数学试题(已下线)第32讲 基本不等式 (讲)- 2022年高考数学一轮复习讲练测(课标全国版)(已下线)专题二 能力提升检测卷(测)- 2022年高考数学一轮复习讲练测(课标全国版)(已下线)课时10 基本不等式及其应用-2022年高考数学一轮复习小题多维练(上海专用)(已下线)专题10 不等式、推理与证明、算法初步、复数-2021年高考真题和模拟题数学(文)分项汇编(全国通用)(已下线)考向08 函数的应用-备战2022年高考数学一轮复习考点微专题(上海专用)炎德英才联考合作体2021-2022学年高三上学期10月联考数学试题湖南省长沙市长郡中学2021-2022学年高三上学期10月月考数学试题广东省南海区佛山市超盈实验中学、佛山市美术实验中学2021-2022学年高一上学期第一次学科素养监测(月考)数学试题(已下线)专题10 不等式、算法初步、复数-五年(2017-2021)高考数学真题分项汇编(文科+理科)湖南省名校联合体2021-2022学年高三上学期10月联考数学试题(已下线)专题01 函数性质、方程、不等式等相结合问题(讲)--第一篇 热点、难点突破篇-《2022年高考数学二轮复习讲练测(新高考·全国卷)》(已下线)专题01 函数性质、方程、不等式等相结合问题(讲)--第一篇 热点、难点突破篇-《2022年高考数学二轮复习讲练测(浙江专用)》(已下线)专题10 函数应用问题-学会解题之高三数学万能解题模板【2022版】(已下线)专题13 《不等式》中的高考真题训练-2021-2022学年高一数学上册同步培优训练系列(苏教版2019)(已下线)第03讲 基本不等式(讲+练)-2023年高考数学一轮复习讲练测(新教材新高考)(已下线)考向09 幂函数与二次函数(重点)(已下线)第09讲 函数模型及其应用(精讲+精练)-2重庆市杨家坪中学2022-2023学年高一上学期10月月考数学试题(已下线)第03讲 基本不等式 (精讲+精练)-2广东省东莞市第一中学2022-2023学年高一上学期第一次月考数学试题河南省洛阳市第一中学2022-2023学年高一上学期12月月考数学试题贵州省松桃苗族自治县群希高级中学有限公司2022-2023学年高一上学期第一次月考数学试题山东省菏泽市单县2022-2023学年高一上学期期末数学试题(已下线)2.2.4 均值不等式及其应用(第2课时)(分层练习)-高一数学同步精品课堂(人教B版2019必修第一册)重庆市辅仁中学校2023-2024学年高一上学期期中考试数学试题
名校
解题方法
2 . 近年来,我国大力发展新能源汽车工业,新能源汽车(含电动汽车)销量已跃居全球首位.某新能源汽车厂根据2021年新能源汽车销售额(单位:万元)和每月销售额占全年销售额的百分比绘制了如图所示双层饼图.根据双层饼图,下列说法错误的是( )
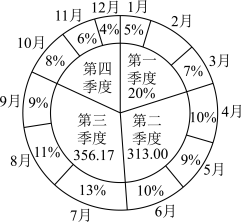
| A.2021年第四季度销售额最低 |
| B.2月销售额占全年销售额的8%. |
| C.2021年全年销售总额约为1079万元 |
| D.7月的销售额约为46万元 |
您最近一年使用:0次
2022-09-14更新
|
317次组卷
|
4卷引用:四川省绵阳南山中学2024届高三下学期高考仿真考试(二)理科数学试题
解题方法
3 . 近年来,国内掀起了全民新中式热潮,新中式穿搭,新中式茶饮,新中式快餐,新中式烘焙等,以下为某纺织厂生产“新中式”面料近5个月的利润y(万元)的统计表.
(1)根据统计表,试求y与x之间的相关系数r(精确到0.001),并利用r说明y与x是否具有较强的线性相关关系;(若 ,则认为两个变量具有较强的线性相关性);
(2)该纺织厂现有甲、乙两条流水线生产同一种产品.为对产品质量进行监控,质检人员先用简单随机抽样的方法从甲、乙两条流水线上分别抽取了4件、2件产品进行初检,再从中随机选取3件做进一步的质检,记抽到“甲流水线产品”的件数为X,试求X的分布列与期望.
附:参考数据:
相关系数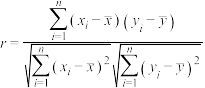 .
.
月份 | 2023.11 | 2023.12 | 2024.01 | 2024.02 | 2024.03 |
月份编号x | 1 | 2 | 3 | 4 | 5 |
利润y(万元) | 27 | 23 | 20 | 17 | 13 |
,则认为两个变量具有较强的线性相关性);(2)该纺织厂现有甲、乙两条流水线生产同一种产品.为对产品质量进行监控,质检人员先用简单随机抽样的方法从甲、乙两条流水线上分别抽取了4件、2件产品进行初检,再从中随机选取3件做进一步的质检,记抽到“甲流水线产品”的件数为X,试求X的分布列与期望.
附:参考数据:
相关系数
.
您最近一年使用:0次
解题方法
4 . 近年来,国内掀起了全民新中式热潮,新中式穿搭,新中式茶饮,新中式快餐,新中式烘焙等,以下为某纺织厂生产“新中式”面料近5个月的利润(y万元)的统计表.
(1)根据统计表,试求y与x之间的相关系数r(精确到0.001),并利用r说明y与x是否具有较强的线性相关关系:(若 ,则认为两个变量具有较强的线性相关性);
(2)从这5个月的利润中任选2个月的利润,分别记为m,n,求事件“m,n均不小于20万元”的概率.
附:参考数据:
相关系数.
月份 | 2023.11 | 2023.12 | 2024.01 | 2024.02 | 2024.03 |
月份编号x | 1 | 2 | 3 | 4 | 5 |
利润(y万元) | 27 | 23 | 20 | 17 | 13 |
,则认为两个变量具有较强的线性相关性);(2)从这5个月的利润中任选2个月的利润,分别记为m,n,求事件“m,n均不小于20万元”的概率.
附:参考数据:
相关系数
.
您最近一年使用:0次
名校
解题方法
5 . 市场监管部门对某线下某实体店2023年前两季度的月利润情况进行调查统计,得到的数据如下:
(1)是否可以用线性回归模型拟合y与x的关系?请用相关系数r加以说明;(参考:若 时,则线性相关程度较高,
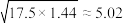
 ,则线性相关程度一般,计算
 时精确度为0.01)
(2)利用最小二乘法求出y关于x的回归方程;用样本估计总体,请预估第9月份的利润.
附:对于一组数据
 ,其回归直线
 的斜率
的斜率
 ,
, .相关系数
.相关系数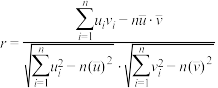 .
.
参考数据: ,
, ,
, ,
, ,
, ,
, .
.
| 月份x | 1 | 2 | 3 | 4 | 5 | 6 |
| 净利润y(万元) | 1.0 | 1.4 | 1.7 | 2.0 | 2.2 | 2.4 |
时,则线性相关程度较高,,则线性相关程度一般,计算时精确度为0.01)(2)利用最小二乘法求出y关于x的回归方程;用样本估计总体,请预估第9月份的利润.
附:对于一组数据
,其回归直线的斜率,.相关系数.参考数据:
,,,,,.
您最近一年使用:0次
2023-07-15更新
|
1153次组卷
|
6卷引用:四川省内江市资中县第二中学2023-2024学年高二下学期5月月考数学试题
四川省内江市资中县第二中学2023-2024学年高二下学期5月月考数学试题河南省驻马店市2022-2023学年高二下学期期末数学试题(已下线)考点巩固卷23 统计与统计案例(十大考点)(已下线)8.2 一元线性回归模型及其应用(6大题型)精练-2023-2024学年高二数学题型分类归纳讲与练(人教A版2019选择性必修第三册)(已下线)专题04 第八章 成对数据的统计分析--高二期末考点大串讲(人教A版2019)(已下线)专题04 成对数据的统计分析-1
6 . 攀枝花属于亚热带季风气候区,水果种类丰富.其中,“红格脐橙”已经“中华人民共和国农业部2010年第1364号公告”予以登记,根据其种植规模与以往的种植经验,产自该果园的单个“红格脐橙”的果径(最大横切面直径,单位: )在正常环境下服从正态分布
 .
.
(1)一顾客购买了10个该果园的“红格脐橙”,求会买到果径小于 的概率;
的概率;
(2)为了提高利润,该果园每年投入一定的资金,对种植、采摘、包装、宣传等环节进行改进.如图是2013年至2022年(单位:万元)与年利润增量y(单位:万元)的散点图:关于的两个回归模型;
模型①:由最小二乘公式可求得与的线性回归方程: ;
;
模型②:由图中样本点的分布,可以认为样本点集中在曲线: 的附近.对投资金额做交换,令
 ,且有
,且有 ,
, ,
, ,
, .
.
(ⅰ)根据所给的统计量,求模型②中关于的回归方程;
(ⅱ)根据下列表格中的数据,比较两种模型的相关指数R2,并选择拟合精度更高、更可靠的模型,预测投资金额为20万元时的年利润增量(结果保留两位小数).
附:若随机变量 ,则
,则 ,
, ;
;
样本 (
( )的最小二乘估计公式为
 ,
, ;
;
相关指数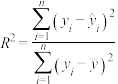 .
.
参考数据: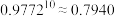 ,
, ,
, ,
, .
.
)在正常环境下服从正态分布.(1)一顾客购买了10个该果园的“红格脐橙”,求会买到果径小于
的概率;(2)为了提高利润,该果园每年投入一定的资金,对种植、采摘、包装、宣传等环节进行改进.如图是2013年至2022年(单位:万元)与年利润增量y(单位:万元)的散点图:
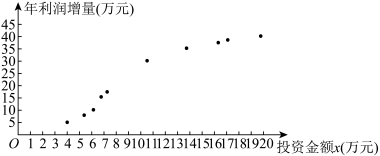
关于的两个回归模型;模型①:由最小二乘公式可求得
与的线性回归方程:;模型②:由图中样本点的分布,可以认为样本点集中在曲线:
的附近.对投资金额做交换,令,且有,,,.(ⅰ)根据所给的统计量,求模型②中
关于的回归方程;(ⅱ)根据下列表格中的数据,比较两种模型的相关指数R2,并选择拟合精度更高、更可靠的模型,预测投资金额为20万元时的年利润增量(结果保留两位小数).
回归模型 | 模型① | 模型② |
回归方程 |
|
|
| 102.28 | 36.19 |
 ,则,;
,则,;样本
()的最小二乘估计公式为,;相关指数
.参考数据:
,,,.
您最近一年使用:0次
名校
7 . 某公司在一次年终总结合上举行抽奖活动,在一个不透明的箱子中放入 个红球和个白球(球的形状和大小都相同),抽奖规则如下:从袋中一次性摸出个球,把白球换成红球再全部放回箱中,设此时箱中红球个数为
 ,则每位员工颁发奖金万元.
(1)求的分布列与数学期望;
(2)若企业有1000名员工,他们为企业贡献的利润近似服从正态分布 ,
, 为各位员工贡献利润数额的均值,计算结果为
 万元,
万元, 为数据的方差,计算结果为
 万元,为激励为企业做出突出贡献的员工,现决定该笔奖金只有贡献利润大于
 万元的员工可以获得,且用于奖励的总奖金按抽奖方案所获奖金的数学期望值计算,求获奖员工的人数及每人可以获得奖金的平均数值(保留到整数).
参考数据:若随机变量 服从正态分布,则
 ,
, .
.
个红球和个白球(球的形状和大小都相同),抽奖规则如下:从袋中一次性摸出个球,把白球换成红球再全部放回箱中,设此时箱中红球个数为,则每位员工颁发奖金万元.(1)求
的分布列与数学期望;(2)若企业有1000名员工,他们为企业贡献的利润近似服从正态分布
,为各位员工贡献利润数额的均值,计算结果为万元,为数据的方差,计算结果为万元,为激励为企业做出突出贡献的员工,现决定该笔奖金只有贡献利润大于万元的员工可以获得,且用于奖励的总奖金按抽奖方案所获奖金的数学期望值计算,求获奖员工的人数及每人可以获得奖金的平均数值(保留到整数).参考数据:若随机变量
服从正态分布,则,.
您最近一年使用:0次
2023-07-04更新
|
509次组卷
|
2卷引用:四川省广安友实学校2023-2024学年高二下学期第三次月考数学试卷
8 . 某超市计划按月订购一种酸奶,每天进货量相同,进货成本每瓶4元,售价每瓶6元,未售出的酸奶降价处理,以每瓶2元的价格当天全部处理完.根据往年销售经验,每天需求量与当天最高气温(单位:℃)有关.如果最高气温不低于25,需求量为500瓶;如果最高气温位于区间 ,需求量为300瓶;如果最高气温低于20,需求量为200瓶.为了确定六月份的订购计划,统计了前三年六月份各天的最高气温数据,得下面的频数分布表:
以最高气温位于各区间的频率代替最高气温位于该区间的概率.
(1)求六月份这种酸奶一天的需求量X(单位:瓶)的分布列.
(2)设六月份一天销售这种酸奶的利润为Y(单位:元),当六月份这种酸奶一天的进货量n(单位:瓶)为多少时,Y的数学期望达到最大值?
,需求量为300瓶;如果最高气温低于20,需求量为200瓶.为了确定六月份的订购计划,统计了前三年六月份各天的最高气温数据,得下面的频数分布表:最高 气温 | [10, 15) | [15, 20) | [20, 25) | [25, 30) | [30, 35) | [35, 40) |
天数 | 2 | 16 | 36 | 25 | 7 | 4 |
(1)求六月份这种酸奶一天的需求量X(单位:瓶)的分布列.
(2)设六月份一天销售这种酸奶的利润为Y(单位:元),当六月份这种酸奶一天的进货量n(单位:瓶)为多少时,Y的数学期望达到最大值?
您最近一年使用:0次
2017-08-07更新
|
6680次组卷
|
33卷引用:四川省资阳市乐至中学2022届高三第一次质量检测数学(理科)试题
四川省资阳市乐至中学2022届高三第一次质量检测数学(理科)试题2017年全国普通高等学校招生统一考试理科数学(新课标3卷精编版)【全国市级联考】河南省南阳市2017-2018学年高二下学期期末考试数学(理)试题【全国市级联考】长春市普通高中2019届高三质量监测(一)理科数学试题【全国百强校】云南省昆明市黄冈实验学校2019届高三上学期期末考试数学(理)试题湖北省黄冈市2018-2019学年高二下学期期末数学(理)试题湖南省郴州市2019-2020学年高三第一次教学质量监测(12月) 数学(理)试题江苏省无锡市大桥实验学校2019-2020学年高二下学期期中数学试题河南省南阳市第一中学校2019-2020学年高二下学期第二次月考(5月)数学(理)试题(已下线)易错点11 概率统计-备战2021年新高考数学一轮复习易错题(已下线)突破2.1离散型随机变量及分其布列突破满分数学之2019-2020学年高二数学(理)重难点突破(人教A版选修2-3)河南省项城三高2019-2020学年度下学期第二次调研考试高二理科数学试题(已下线)专题32 概率和统计【理】-十年(2011-2020)高考真题数学分项(五)人教B版(2019) 选择性必修第二册 过关斩将 第四章 概率与统计 4.2 随机变量 4.2 综合拔高练(已下线)易错点13 概率与统计-备战2021年高考数学(理)一轮复习易错题(已下线)易错点13 概率与统计-备战2021年高考数学(文)一轮复习易错题(已下线)7.3 离散型随机变量的数字特征(精练)-2020-2021学年高二数学一隅三反系列(人教A版2019选择性必修第三册)(已下线)解密09 概率、随机变量及其分布列(讲义)-【高频考点解密】2021年新高考数学二轮复习讲义+分层训练北师大版(2019) 选修第一册 必杀技 第六章 素养检测人教A版(2019) 选修第三册 必杀技 第七章检测河北省武安市第一中学2022届高三上学期第五次调研数学试题(已下线)专题20统计概率解答题20题-备战2022年高考数学冲刺横向强化精练精讲(新高考专用)(已下线)专题52 盘点随机变量分布列及期望的问题——备战2022年高考数学二轮复习常考点专题突破(已下线)数学-2022年高考押题预测卷02(江苏专用)(已下线)专题13 概率统计解答题安徽省芜湖市第一中学2020届高三下学期3月第五次线上考试数学试题(已下线)模块三 专题6 概率与统计3.2 离散型随机变量及其分布列江苏省南京师范大学灌云附属中学、灌南县第二中学2023-2024学年高三上学期10月阶段性联考数学试题(已下线)第六节 离散型随机变量的数字特征(讲) 一轮复习点点通(已下线)8.4 离散型随机变量的分布列,期望与方差(高考真题素材之十年高考)(已下线)专题25 概率统计解答题(理科)-2专题33概率统计解答题(第二部分)
真题
名校
9 . 某超市计划按月订购一种酸奶,每天进货量相同,进货成本每瓶4元,售价每瓶6元,未售出的酸奶降价处理,以每瓶2元的价格当天全部处理完.根据往年销售经验,每天需求量与当天最高气温(单位:℃)有关.如果最高气温不低于25,需求量为500瓶;如果最高气温位于区间[20,25),需求量为300瓶;如果最高气温低于20,需求量为200瓶.为了确定六月份的订购计划,统计了前三年六月份各天的最高气温数据,得下面的频数分布表:
最高气温 | [10,15) | [15,20) | [20,25) | [25,30) | [30,35) | [35,40) |
天数 | 2 | 16 | 36 | 25 | 7 | 4 |
以最高气温位于各区间的频率估计最高气温位于该区间的概率.
(1)求六月份这种酸奶一天的需求量不超过300瓶的概率;
(2)设六月份一天销售这种酸奶的利润为Y(单位:元),当六月份这种酸奶一天的进货量为450瓶时,写出Y的所有可能值,并估计Y大于零的概率.
您最近一年使用:0次
2017-08-07更新
|
19066次组卷
|
66卷引用:【全国百强校】四川省棠湖中学2017-2018学年高二零诊模拟数学(理)试题
【全国百强校】四川省棠湖中学2017-2018学年高二零诊模拟数学(理)试题四川省成都市龙泉驿区东竞高级中学2023-2024学年高二上学期期中数学试题2017年全国普通高等学校招生统一考试文科数学(新课标3卷精编版)河南省中原名校2018届高三第三次质量考评试卷理科数学试题湖南省衡阳市第八中学2017-2018学年高二上学期期中考试数学(文)试题人教A版高中数学必修三 学业质量标准检测 算法初步和统计2017-2018学年人教A版高中数学选修2-3 综合质量评估2018届高考数学高考复习指导大二轮专题复习:专题七 概率与统计 测试题7(已下线)《考前20天终极攻略》5月30日 概率【理科】(已下线)《考前20天终极攻略》5月30日 概率【文科】(已下线)《高频考点解密》—解密25 概率(已下线)解密23 概率-备战2018年高考文科数学之高频考点解密【全国百强校】北京市人大附中2018届高三5月考前热身练习(三模)数学文科试题【全国百强校】吉林省长春外国语学校2017-2018学高二下学期期末考试数学(文)试题【全国百强校】吉林省长春外国语学校2017-2018学高二下学期期末考试数学(理)试题北京市人大附中2018届高三下学期三模考试数学(文科)试题【全国校级联考】湖南省衡阳县2017-2018学年高二下学期期末考试数学(文)试题【市级联考】长春市普通高中2019届高三质量监测(一)文科数学试题湖南省长沙市雅礼中学2019届高三上学期月考二数学(理)试题【全国百强校】黑龙江省大庆实验中学2018-2019学年高二上学期期中考试数学(文)试题【全国百强校】云南省昆明市黄冈实验学校2019届高三上学期期末考试数学(文)试题(已下线)2019年6月22日 《每日一题》文数-周末培优智能测评与辅导[文]-概率与统计(已下线)7.概率与统计[文] -《备战2020年高考精选考点专项突破题集》(已下线)专题11.4 随机事件的概率(讲)【理】-《2020年高考一轮复习讲练测》(已下线)专题10.4 随机事件的概率(讲)【文】-《2020年高考一轮复习讲练测》(已下线)专题10.4 随机事件的概率(练)【文】-《2020年高考一轮复习讲练测》(已下线)专题11.4 随机事件的概率(练)【理】-《2020年高考一轮复习讲练测》人教B版(2019) 必修第二册 逆袭之路 第五章 统计与概率 专题二 高考中的统计与概率问题人教A版(2019) 必修第二册 逆袭之路 第十章 概率 专题七 高考中的概率问题人教A版(2019) 必修第二册 过关斩将 第十章 10.2~10.3 综合拔高练人教A版(2019) 必修第二册 必杀技 第10章 素养检测(已下线)卷10-备战2020年新高考数学自学检测黄金10卷-《2020年新高考政策解读与配套资源》(已下线)基础套餐练02-【新题型】2020年新高考数学多选题与热点解答题组合练2020届江西省南昌市江西师范大学附属中学高三第一次模拟测试卷理科数学湖南省衡阳市第八中学2018-2019学年高三下学期第十二次月考数学(文)试题(已下线)专题16 概率与统计综合-五年(2016-2020)高考数学(文)真题分项河北省安平中学2020-2021学年高二上学期第一次月考数学试题山东省青岛市胶州市实验中学2019-2020学年第二学期高一数学期中模拟检测(二)(已下线)考点31 统计、统计案例-2021年新高考数学一轮复习考点扫描(已下线)专题11.3 随机事件的概率(精讲)-2021年高考数学(理)一轮复习讲练测(已下线)考点45 随机事件的概率-备战2021年高考数学(文)一轮复习考点一遍过安徽省合肥市第十中学2020-2021学年高三上学期12月阶段性检测数学(文)试题河北省衡水市安平中学2020-2021学年高一下学期期末数学试题(已下线)专题14 概率统计-十年(2012-2021)高考数学真题分项汇编(全国通用)广东省佛山市南海区狮山石门高级中学2021-2022学年高二上学期第一次统测数学试题新疆哈密市第十五中学2022届高三上学期第一次月考数学试题(已下线)专题09 概率与统计(文)-五年(2017-2021)高考数学真题分项汇编(文科+理科)(已下线)第51讲 随机事件的概率 (练) — 2022年高考数学一轮复习讲练测(课标全国版)(已下线)第51讲 随机事件的概率 (讲) — 2022年高考数学一轮复习讲练测(课标全国版)(已下线)专题21 概率统计(文科)解答题20题-备战2022年高考数学冲刺横向强化精练精讲(已下线)押全国卷(文科)第18题 概率与统计-备战2022年高考数学(文)临考题号押题(全国卷)(已下线)第02讲 随机事件的概率-【帮课堂】2021-2022学年高一数学同步精品讲义(苏教版2019必修第二册)(已下线)专题10.3 频率与概率-2021-2022学年高一数学课后培优练(人教A版2019必修第二册)福建省厦门第一中学2019-2020学年高一上学期入学考试数学试题(已下线)专题14 概率统计解答题-2(已下线)第69讲 随机事件的概率、古典概型、条件概率(已下线)13.1 随机事件的概率与古典概型(已下线)13.高考大题综合训练[文] -《备战2020年高考精选考点专项突破题集》河南省郑州市新郑市第一中学2022-2023学年高一下学期6月月考数学试题河南省孟津区第一高级中学2022-2023学年高一下学期6月月考数学试题河南省安阳市林州市第一中学2022-2023学年高二下学期7月月考数学试题河南省漯河市高级中学2023-2024学年高三上学期摸底考试数学试题北师大版(2019) 必修第一册 数学奇书 第七章 概 率 章末整合提升(已下线)10.3.1频率的稳定性+10.3.2随机模拟【第三练】“上好三节课,做好三套题“高中数学素养晋级之路专题33概率统计解答题(第一部分)
10 . 为了在夏季降温和冬季供暖时减少能源损耗,房屋的屋顶和外墙需要建造隔热层.某幢建筑物要建造可使用20年的隔热层,每厘米厚的隔热层建造成本为6万元.该建筑物每年的能源消耗费用C(单位:万元)与隔热层厚度x(单位:cm)满足关系:C(x)=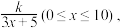 若不建隔热层,每年能源消耗费用为8万元.设f(x)为隔热层建造费用与20年的能源消耗费用之和.
(Ⅰ)求k的值及f(x)的表达式.
(Ⅱ)隔热层修建多厚时,总费用f(x)达到最小,并求最小值.
若不建隔热层,每年能源消耗费用为8万元.设f(x)为隔热层建造费用与20年的能源消耗费用之和.(Ⅰ)求k的值及f(x)的表达式.
(Ⅱ)隔热层修建多厚时,总费用f(x)达到最小,并求最小值.
您最近一年使用:0次
2019-01-30更新
|
4238次组卷
|
129卷引用:四川省盐亭中学2021-2022学年高二下学期第四学月教学质量测试数学(文)试题
四川省盐亭中学2021-2022学年高二下学期第四学月教学质量测试数学(文)试题2010年普通高等学校招生全国统一考试(湖北卷)数学(理科)(已下线)2010年高考试题分项版理科数学之专题二 函数(已下线)2010年高考试题分项版理科数学之专题十三 导数(已下线)2011届江苏省宿豫中学高三第二次模拟考试数学试卷(已下线)2011届广东省华南师大附中高三综合测试数学文卷(已下线)2011届江西省鹰潭市高三第二次模拟考试理科数学卷(已下线)2012届山东省聊城莘县实验高中高三上学期期中考试数学(已下线)2012届黑龙江省大庆铁人中高三第一学期期末考试理科数学(已下线)2012届上海市七宝中学高三模拟考试理科数学(已下线)2011—2012学年江苏省赣榆县厉庄高级中学度高二下期中文科数学试卷(已下线)2012-2013学年黑龙江省大庆铁人中学高二下学期期末考试文科数学卷(已下线)2014届浙江省慈溪中学高三第一学期10月月考文科数学试卷(已下线)2014届陕西咸阳范公中学高三上学期摸底考试文科数学试卷(已下线)2013-2014学年甘肃省兰州一中高二下学期期中考试理科数学试卷(已下线)2013-2014学年甘肃省兰州一中高二下学期期中考试文科数学试卷(已下线)2013-2014学年甘肃兰州一中高二下学期期中理科数学试卷(已下线)2013-2014学年甘肃兰州一中高二下学期期中文科数学试卷(已下线)2015届河南省实验中学高三上学期期中考试文科数学试卷2015届上海市崇明县高三第二次高考模拟考试理科数学试卷2015届上海市崇明县高三第二次高考模拟考试文科数学试卷2014-2015学年江西省白鹭洲中学高一下学期期中考试数学试卷2015-2016学年湖北省广华中学高一9月阶段测试数学试卷2014-2015学年江西省余江县一中高一下学期期中数学试卷2015-2016学年内蒙古准格尔旗世纪中学高二下第一次月考理科数学卷2015-2016学年甘肃省武威民勤一中高二下期中理科数学试卷2015-2016年江西省上饶市铅山一中高二下期中理科数学试卷(已下线)同步君人教A版必修5第三章3.4 基本不等式2016-2017学年江西吉安一中高一上段考一数学试卷2017届广东中山一中高三上学期统测二数学(文)试卷2016-2017学年安徽六安一中高二理上学期周检八数学试卷2016-2017学年安徽省六安市第一中学高二下学期第一次阶段检测数学(理)试卷山东省平阴第二中学2016-2017高一下学期6月月调研卷数学(理)试题重庆市铜梁县第一中学2018届高三9月月考数学(理)试题福建省泉州市南安第一中学2016-2017学年高二下学期期末考试数学(理)试题高中数学人教版 必修5 第三章 不等式 3.4 基本不等式(已下线)学科网2019年高考数学一轮复习讲练测2.9函数模型及其应用【江苏版】【讲】(已下线)2019高考备考一轮复习精品资料 【理】专题十二 函数模型及其应用 教学案(已下线)2018年10月13日 《每日一题》人教必修5-周末培优人教版 全能练习 选修1-1【提分攻略】第四章 导数应用(已下线)2019高考热点题型和提分秘籍 【理数】专题9 函数模型及其应用( 题型专练)(已下线)2019高考热点题型和提分秘籍 【理数】专题9 函数模型及其应用( 教学案)(已下线)2019高考热点题型和提分秘籍 【文数】专题9 函数模型及其应用 (教学案)【全国百强校】上海市交通大学附属中学2017-2018学年高一上学期期末数学试题【校级联考】福建省厦门六中2018-2019学年高二(上)期中理科数学试题【全国百强校】广东省广州市第六中学2018-2019学年高一下学期期中数学试题【校级联考】黑龙江省哈尔滨市呼兰一中、阿城二中、宾县三中、尚志五中四校2018-2019学年高二下学期期中考试数学(理)试题(已下线)专题2.9 函数模型及其应用(讲)【文】-2020年高考一轮复习讲练测(已下线)专题2.9 函数模型及其应用(讲)【理】-《2020年高考一轮复习讲练测》山东省济南第一中学2017届高三10月阶段测试数学(文)试题(已下线)2019年10月13日 每周一测-学易试题君之每日一题君2019-2020学年上学期高二数学人教版(必修5)(已下线)2019年10月13日 《每日一题》 必修5-每周一测安徽省黄山市屯溪第一中学2019-2020学年高一上学期10月月考数学试题上海市交通大学附属中学2018-2019学年高一下学期开学考试数学试题上海市上海交通大学附属中学2019-2020学年高一上学期期中数学试题上海市控江中学2018-2019学年高三上学期开学考试数学试题江苏省淮安市盱眙县马坝高级中学2019-2020学年高二上学期期中数学试题上海市曹杨第二中学2018-2019学年高一上学期期中数学试题上海市普陀区长征中学2018-2019学年高三上学期期中数学试题上海市南洋模范中学2017-2018学年高一上学期期中数学试题(已下线)专题15 以导数为背景的应用题-《巅峰冲刺2020年高考之二轮专项提升》(江苏)上海市行知中学2018届高三上学期期中数学试题2016届上海市高考最后冲刺模拟(一)(文)数学试题上海市曹杨二中2015-2016学年高一上学期期中数学试题上海市向明中学2016-2017学年高一上学期期中数学试题湖南省岳阳市第一中学2019-2020学年高一上学期期中数学试题江苏省苏州市陆慕高级中学2019-2020学年高二下学期在线学习质量检测数学试题江苏省徐州市铜山区大许中学2019-2020学年高二下学期期中数学试题江苏省徐州市丰县中学2019-2020学年高二下学期期中数学试题(已下线)专题2.9 函数模型及其应用(精讲)-2021届高考数学(理)一轮复习讲练测(已下线)第12讲 函数与数学模型-2021年新高考数学一轮专题复习(新高考专版)(已下线)测试卷07 函数的应用-2021届高考数学一轮复习(文理通用)单元过关测试卷江苏省南通市四校(四星级学校)2020-2021学年高三上学期第一次联考数学试题上海市曹杨二中2020-2021学年高一上学期期中仿真密卷数学试题江苏省苏州市张家港市梁丰高级中学2020-2021学年高二上学期期中数学试题(已下线)5.3.2 函数的极值与最大(小)值(2)导学案河南省郑州市第七高级中学2020~2021学年高二上学期期中考试理科数学试题(已下线)【新东方】【2021.5.25】【NB】【高一上】【高中数学】【NB00100】(已下线)专题12 导数在函数有关问题及实际生活中的应用 知识精讲 广东省佛山市顺德区罗定邦中学2020-2021学年高二下学期期中数学试题重庆市綦江中学2020-2021学年高二下学期第一次阶段性考试数学试题上海市建平中学2022届高三上学期9月开学考试数学试题(已下线)6.3 利用导数解决实际问题(课后作业)-2020-2021学年高中数学同步备课学案(2019人教B版选择性必修第三册)北师大版(2019) 选修第二册 名师精选 测试二 高考水平模拟性测试卷云南大学附属中学星耀学校2021-2022学年高一上学期期中考试数学试题江西省萍乡市芦溪中学2022届高三上学期第一次段考数学(理)试题(已下线)卷18 选择性必修第二册综合性测试卷 ·B卷·能力提升-【重难点突破】2021-2022学年高二数学名校好题汇编同步测试卷(人教A版选择性必修第二册) 湖北省2021-2022学年高一上学期期末调考数学试题江西省2021-2022学年高一上学期期末调研测试数学试题人教B版(2019) 选修第三册 名师精选 高考水平模拟性测试卷河南省驻马店市2021-2022学年高二上学期期终考试文科数学试题河南省驻马店市2021-2022学年高二上学期期终考试理科数学试题(已下线)复习题二2(已下线)第二章 一元二次函数、方程和不等式单元总结(思维导图+知识记诵+能力培养)-【一堂好课】2021-2022学年高一数学上学期同步精品课堂(人教A版2019必修第一册)北京市通州区2021-2022学年高二下学期期中质量检测数学试题福建省宁德市同心顺联盟2021-2022学年高二下学期期中联合考试数学试题湖南省岳阳市华容县第一中学2021-2022学年高一下学期开学考试数学试题(已下线)专题03 均值不等式及其应用(讲义)-2023年高考数学一轮复习精讲精练宝典(新高考专用)(已下线)3.3 函数的应用(一)(已下线)专题21 函数的应用(一)(1)上海市曹杨第二中学2022-2023学年高一上学期期中数学试题河北省保定市蠡县第二中学2022-2023学年高一上学期12月月考数学试题上海市文来高中2023届高三上学期期中数学试题河北省保定市第三中学2022-2023学年高一上学期期末数学试题江苏省南京市第二十七高级中学2022-2023学年高二上学期期末数学试题广东省深圳技术大学附属中学2022-2023学年高二下学期第一次月考数学试题安徽省皖北县中联盟2022-2023学年高二下学期3月联考数学试题陕西省渭南市韩城市新蕾中学2020-2021学年高二下学期第四次月考文科数学试题河北省邯郸市鸡泽县第一中学2022-2023学年高二下学期第一次月考数学试题(已下线)第5章导数及其应用(2) (A卷·知识通关练)安徽省庐巢七校联考2022-2023学年高二下学期3月期中数学试题(已下线)第五章 一元导数及其应用章末重点题型归纳(3)(已下线)拓展十二:导数大题的8种常见考法总结(2)山东省泰安市宁阳县第四中学2022-2023学年高二下学期6月月考数学试题3.4 函数的应用(一)(已下线)重难点04导数的应用六种解法(2)甘肃省天水市第一中学2022-2023学年高二下学期3月月考数学试题(已下线)第2章 一元二次函数、方程和不等式(基础、典型、易错、新文化、压轴)分类专项训练-2022-2023学年高一数学考试满分全攻略(人教A版2019必修第一册)广东省深圳市人大附中深圳学校2022-2023学年高二下学期期中数学试题湘教版(2019)必修第一册课本习题第2章复习题广东省深圳市第三高级中学2022-2023学年高二下学期期中数学试题宁夏银川市第九中学2023-2024学年高一上学期第一次月考数学试题福建省莆田哲理中学2023-2024学年高一上学期10月月考数学试题广东省广州市番禺区洛溪新城中学2023-2024学年高一上学期10月月考数学试题海南省海口市观澜湖华侨学校2023-2024学年高一上学期10月月考数学试题甘肃省兰州市兰州第一中学2023-2024学年高三上学期期中数学试题人教A版(2019) 选修第二册 数学奇书 第五章 一元函数的导数及其应用 5.3.2 函数的极值与最大(小)值 第2课时 函数的最大(小)值湖南省衡阳市衡阳县2023-2024学年高一上学期1月期末质量检测数学试题上海市闵行(文琦)中学2023-2024学年高一下学期3月月考数学试卷


