名校
1 . 已知函数f(x)=lnx.
(Ⅰ)若方程f(x+a)=x有且只有一个实数解,求a的值;
(Ⅱ)若函数g(x)=f(x)+ x2 – mx ( m≥
 )的极值点 x1,x2(x1<x2)恰好是函数h(x)=f(x)-cx2-bx的零点,求的y=(x1 - x2)h’(
 )最小值.
)最小值.
(Ⅰ)若方程f(x+a)=x有且只有一个实数解,求a的值;
(Ⅱ)若函数g(x)=f(x)+
x2 – mx ( m≥ )的极值点 x1,x2(x1<x2)恰好是函数h(x)=f(x)-cx2-bx的零点,求的y=(x1 - x2)h’()最小值.
您最近一年使用:0次
2016-12-04更新
|
773次组卷
|
4卷引用:2016届江苏省泰州市姜堰区高三下期初考试数学试卷
2014·重庆·一模
2 . 已知向量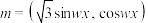 ,
,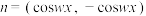 ,其中,
,其中, .函数
.函数 的最小正周期为
 .
.
(1)求 的值;
的值;
(2)设 的三边
的三边 、
、 、
、 满足
满足 ,且边所对的角
 ,若关于的方程
 有两个不同的实数解,求实数
 的取值范围.
,,其中,.函数的最小正周期为.(1)求
的值;(2)设
的三边、、满足,且边所对的角,若关于的方程有两个不同的实数解,求实数的取值范围.
您最近一年使用:0次
2013·福建·一模
3 . 已知 为坐标原点,对于函数
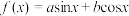 ,称向量
,称向量 为函数
为函数 的伴随向量,同时称函数为向量
 的伴随函数.
(Ⅰ)设函数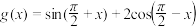 ,试求
,试求 的伴随向量的模;
(Ⅱ)记 的伴随函数为
 ,求使得关于的方程
 在
在 内恒有两个不相等实数解的实数的取值范围.
为坐标原点,对于函数,称向量为函数的伴随向量,同时称函数为向量的伴随函数.(Ⅰ)设函数
,试求的伴随向量的模;(Ⅱ)记
的伴随函数为,求使得关于的方程在内恒有两个不相等实数解的实数的取值范围.
您最近一年使用:0次
2021·上海浦东新·三模
名校
4 . 某工厂承接制作各种弯管的业务,其中一类弯管由两节圆管组成,且两节圆管是形状、大小均相同的斜截圆柱,其尺寸如图1所示(单位: ),其中斜截面与底面所成的角为
 ,将其中一个斜截圆柱的侧面沿
 剪开并摊平,可以证明由截口展开而成的曲线
 是函数
是函数 的图像,其中
 ,
, ,如图2所示.
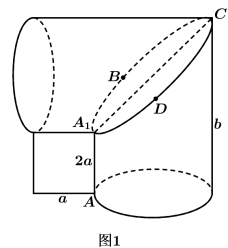
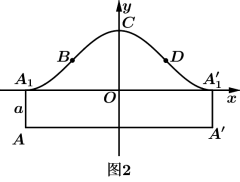
(1)若 ,求
,求 的解析式;
的解析式;
(2)已知函数的图像与x轴围成区域的面积可由公式 计算,若制作该种该类弯管的一截圆管所用材料面积(即斜截圆柱的侧面积)等于与之底面相同且高为
 的圆柱的面积,求的值(结果精确到
 ).
).
),其中斜截面与底面所成的角为,将其中一个斜截圆柱的侧面沿剪开并摊平,可以证明由截口展开而成的曲线是函数的图像,其中,,如图2所示.(1)若
,求的解析式;(2)已知函数
的图像与x轴围成区域的面积可由公式计算,若制作该种该类弯管的一截圆管所用材料面积(即斜截圆柱的侧面积)等于与之底面相同且高为的圆柱的面积,求的值(结果精确到).
您最近一年使用:0次
5 . 消费者信心指数是反映消费者信心强弱的指标;它是预测经济走势和消费趋向的一个先行指标,是监测经济周期变化的重要依据.消费者信心指数值介于0和200之间.指数超过100时,表明消费者信心处于强信心区;指数等于100时,表示消费者信心处于强弱临界点;指数小于100时,表示消费者信心处于弱信心区.我国某城市从2016年到2019年各季度的消费者信心指数如下表1:
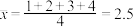
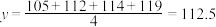
记2016年至2019年年份序号为 ,该城市各年消费者信心指数的年均值(四舍五入取整)为y,x与y的关系如下表2:
(1)该城市在2017年和2018年的四个季度的消费者信心指数中各任取一个,求2018年的消费者信心指数不小于2017年的消费者信心指数的概率;
(2)根据表2得到线性回归方程为: ,求
,求 的值,并预报该城市2020年消费者信心指数的年平均值.
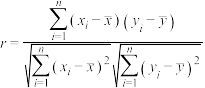
(3)根据表2计算 的相关系数r(保留两位小数),并判断是否正相关很强.
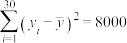
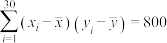
参考数据和公式: ;
; ;
; ;
; ;
; ;
; ;当
;当 时,y与x正相关很强.
| 2016年 | 2017年 | 2018年 | 2019年 | |
| 第一季度 | 104.50 | 111.70 | 118.50 | 119.30 |
| 第二季度 | 104.00 | 110.20 | 114.60 | 118.20 |
| 第三季度 | 105.50 | 114.20 | 110.20 | 118.10 |
| 第四季度 | 106.80 | 113.20 | 113.20 | 119.30 |
,该城市各年消费者信心指数的年均值(四舍五入取整)为y,x与y的关系如下表2:| 年份序号x | 1 | 2 | 3 | 4 |
| 消费者信心指数年均值y | 105 | 112 | 114 | 119 |
(2)根据表2得到线性回归方程为:
,求的值,并预报该城市2020年消费者信心指数的年平均值.(3)根据表2计算
的相关系数r(保留两位小数),并判断是否正相关很强.参考数据和公式:
;;;;;;当时,y与x正相关很强.
您最近一年使用:0次
名校
6 . 某湿地公园经过近十年的规划和治理,生态系统得到很大改善,野生动物数量有所增加.为调查该地区某种野生动物的数量,将其分成面积相近的300个地块,并设计两种抽样方案,方案一:在该地区应用简单随机抽样的方法抽取30个作为样本区;依据抽样数据计算得到相应的相关系数 ;方案二:在该地区应用分层抽样的方法抽取30个作为样本区,调查得到样本数据
 (
( ,2,…,30),其中
 和
和 分别表示第i个样区的植物覆盖面积(单位:公顷)和这种野生动物的数量,并计算得
 ,
, ,
, ,
, ,
, .
.
(1)求该地区这种野生动物数量的估计值(这种野生动物数量的估计值等于样区这种野生动物数量的平均数乘以地块数);
(2)求方案二抽取的样本(,2,…,30)的相关系数(精确到0.01);并判定哪种抽样方法更能准确的估计.
附:相关系数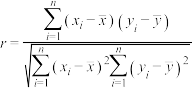 ,
, ;相关系数
;相关系数 ,则相关性很强,
 的值越大,相关性越强.
;方案二:在该地区应用分层抽样的方法抽取30个作为样本区,调查得到样本数据(,2,…,30),其中和分别表示第i个样区的植物覆盖面积(单位:公顷)和这种野生动物的数量,并计算得,,,,.(1)求该地区这种野生动物数量的估计值(这种野生动物数量的估计值等于样区这种野生动物数量的平均数乘以地块数);
(2)求方案二抽取的样本
(,2,…,30)的相关系数(精确到0.01);并判定哪种抽样方法更能准确的估计.附:相关系数
,;相关系数,则相关性很强,的值越大,相关性越强.
您最近一年使用:0次
2020-10-24更新
|
928次组卷
|
17卷引用:陕西省宝鸡市金台区2020-2021学年高三上学期11月教学质量检测文科数学试题
陕西省宝鸡市金台区2020-2021学年高三上学期11月教学质量检测文科数学试题陕西省宝鸡市金台区2020-2021学年高三上学期11月教学质量检测理科数学试题(已下线)专题32 回归分析(解答题)-2021年高考数学(理)二轮复习热点题型精选精练(已下线)专题30 回归分析(解答题)-2021年高考数学(文)二轮复习热点题型精选精练(已下线)专题30 回归分析(解答题)-2021年高考数学二轮复习热点题型精选精练(新高考地区专用)湖南省长沙市长郡中学2020-2021学年高二上学期新高考选科适应性调查考试数学试题湖南省长沙市联合体2020-2021学年高二上学期10月联考数学试题安徽省阜阳市太和第一中学2020-2021学年高二上学期12月月考理科数学(奥赛班)试题安徽省阜阳市太和第一中学2020-2021学年高二(平行班)上学期12月月考理科数学试题(已下线)8.1 成对数据的相关关系(精练)-2020-2021学年高二数学一隅三反系列(人教A版2019选择性必修第三册)(已下线)专题4.7一元线性回归模型(B卷提升篇)-2020-2021学年高二数学选择性必修第二册同步单元AB卷(新教材人教B版)(已下线)【新教材精创】8.1 成对数据的相关关系 ---B提高练重庆市清华中学校2020-2021学年高二下学期期中数学试题重庆市清华中学2020-2021学年高二下学期5月月考数学试题(已下线)8.1.1-8.1.2变量的相关关系、样本相关系数(已下线)8.1成对数据的统计相关性B卷江西省宜春市奉新县第一中学2021-2022学年高二下学期第一次月考数学(文)试题
名校
7 . 某工厂引进新的生产设备M,为对其进行评估,从设备M生产零件的流水线上随机抽取100件零件作为样本,测量其直径后,整理得到下表:
经计算,样本的平均值 ,标准差
,标准差 ,以频率值作为概率的估计值.
(1)为评估设备M对原材料的利用情况,需要研究零件中某材料含量y和原料中的该材料含量x之间的相关关系,现取了8对观测值,求y与x的线性回归方程.
附:①对于一组数据 ,其回归直线
 的斜率和截距的最小二乘法估计公式分别为
 ,
, ;②参考数据:
 ,
, ,
, ,
, .
.
(2)为评判设备M生产零件的性能,从该设备加工的零件中任意抽取一件,记其直径为X,并根据以下不等式进行评判(P表示相应事件的概率);
① ;②
;② ;
;
③ .
.
评判规则为:若同时满足上述三个不等式,则设备等级为甲;仅满足其中两个,则等级为乙;若仅满足其中一个,则等级为丙;若全部不满足,则等级为丁,试判断设备M的性能等级.
(3)将直径小于等于 或直径大于
或直径大于 的零件认为是次品.从样本中随意抽取2件零件,再从设备M的生产流水线上随意抽取2件零件,计算其中次品总数Y的数学期望E(Y).
直径/ | 58 | 59 | 61 | 62 | 63 | 64 | 65 | 66 | 67 | 68 | 69 | 70 | 71 | 73 | 合计 |
| 件数 | 1 | 1 | 3 | 5 | 6 | 19 | 33 | 18 | 4 | 4 | 2 | 1 | 2 | 1 | 100 |
,标准差,以频率值作为概率的估计值.(1)为评估设备M对原材料的利用情况,需要研究零件中某材料含量y和原料中的该材料含量x之间的相关关系,现取了8对观测值,求y与x的线性回归方程.
附:①对于一组数据
,其回归直线的斜率和截距的最小二乘法估计公式分别为,;②参考数据:,,,.(2)为评判设备M生产零件的性能,从该设备加工的零件中任意抽取一件,记其直径为X,并根据以下不等式进行评判(P表示相应事件的概率);
①
;②;③
.评判规则为:若同时满足上述三个不等式,则设备等级为甲;仅满足其中两个,则等级为乙;若仅满足其中一个,则等级为丙;若全部不满足,则等级为丁,试判断设备M的性能等级.
(3)将直径小于等于
或直径大于的零件认为是次品.从样本中随意抽取2件零件,再从设备M的生产流水线上随意抽取2件零件,计算其中次品总数Y的数学期望E(Y).
您最近一年使用:0次
2021-05-31更新
|
2104次组卷
|
6卷引用:湖南师范大学附属中学2021届高三下学期三模数学试题
湖南师范大学附属中学2021届高三下学期三模数学试题湖南师大附中2021届高三高考数学模拟试题(三)(已下线)第18题 随机变量的分布列及期望的应用-2021年高考数学真题逐题揭秘与以例及类(新高考全国Ⅰ卷)(已下线)专题03 正态分布-【解题思路培养】2022年高考数学一轮复习解答题拿分秘籍(全国通用版)(已下线)7.5 正态分布 (精讲)(2)(已下线)7.5 正态分布(2)
名校
8 . 某种植园在芒果临近成熟时,随机从一些芒果树上摘下100个芒果,其质量(单位:克)分别在[100,150),[150,200),[200,250),[250,300),[300,350),[350,400]中,经统计得频率分布直方图如图所示.
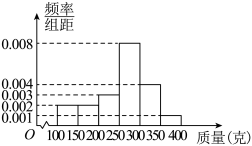
(1)现按分层抽样的方法从质量为[250,300),[300,350)内的芒果中随机抽取6个,再从这6个中随机抽取3个,求这3个芒果中恰有1个在[300,350)内的概率;
(2)某经销商来收购芒果,以各组数据的中间数代表这组数据的平均值,用样本估计总体,该种植园中还未摘下的芒果大约还有10 000个,经销商提出如下两种收购方案:A方案:所有芒果以10元/千克收购;B方案:对质量低于250克的芒果以2元/个收购,高于或等于250克的以3元/个收购.通过计算确定种植园选择哪种方案获利更多?
(1)现按分层抽样的方法从质量为[250,300),[300,350)内的芒果中随机抽取6个,再从这6个中随机抽取3个,求这3个芒果中恰有1个在[300,350)内的概率;
(2)某经销商来收购芒果,以各组数据的中间数代表这组数据的平均值,用样本估计总体,该种植园中还未摘下的芒果大约还有10 000个,经销商提出如下两种收购方案:A方案:所有芒果以10元/千克收购;B方案:对质量低于250克的芒果以2元/个收购,高于或等于250克的以3元/个收购.通过计算确定种植园选择哪种方案获利更多?
您最近一年使用:0次
2020-06-24更新
|
257次组卷
|
2卷引用:湖南省常德市第二中学2020届高三下学期临考冲刺数学(文)试题
名校
解题方法
9 . 某果园今年的脐橙丰收了,果园准备利用互联网销售.为了更好的销售,现随机摘下了 个脐橙进行测重,其质量分布在区间
 内(单位:克),统计质量的数据作出频率分布直方图如下图所示:
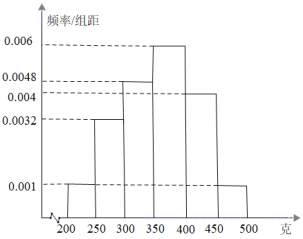
(1)按分层抽样的方法从质量落在 ,
, 的脐橙中随机抽取
 个,再从这个脐橙中随机抽
 个,求这个脐橙质量都不小于
 克的概率;
克的概率;
(2)以各组数据的中间数值代表这组数据的平均水平,以频率代表概率,已知该果园的脐橙树上大约还有 个脐橙待出售,某电商提出两种收购方案:甲:所有脐橙均以
 元/千克收购;乙:低于
 克的脐橙以元/个收购,高于或等于克的以元/个收购.请通过计算为该果园选择收益最好的方案.
(参考数据: )
)
个脐橙进行测重,其质量分布在区间内(单位:克),统计质量的数据作出频率分布直方图如下图所示:(1)按分层抽样的方法从质量落在
,的脐橙中随机抽取个,再从这个脐橙中随机抽个,求这个脐橙质量都不小于克的概率;(2)以各组数据的中间数值代表这组数据的平均水平,以频率代表概率,已知该果园的脐橙树上大约还有
个脐橙待出售,某电商提出两种收购方案:甲:所有脐橙均以元/千克收购;乙:低于克的脐橙以元/个收购,高于或等于克的以元/个收购.请通过计算为该果园选择收益最好的方案.(参考数据:
)
您最近一年使用:0次
10 . 某公司为了了解一种新产品的销售情况,对该产品100天的销售数量做调查,统计数据如下图所示:
经计算,上述样本的平均值 ,标准差
,标准差 .
.
(Ⅰ)求表格中字母 的值;
的值;
(Ⅱ)为评判该公司的销售水平,用频率近似估计概率,从上述100天的销售业绩中随机抽取1天,记当天的销售数量为 ,并根据以下不等式进行评判(
 表示相应事件的概率);
① ;②
;② ;③
;③ .
.
评判规则是:若同时满足上述三个不等式,则销售水平为优秀;仅满足其中两个,则等级为良好;若仅满足其中一个,则等级为合格;若全部不满足,则等级为不合格.试判断该公司的销售水平;
(Ⅲ)从上述100天的样本中随机抽取2个,记样本数据落在 内的数量为
内的数量为 ,求的分布列和数学期望.
销售数量(件) | 48 | 49 |
| 52 | 63 | 64 | 65 | 66 | 67 | 68 | 69 | 70 | 71 | 73 |
天数 | 1 | 1 | 3 | 5 | 6 | 19 | 33 | 18 | 4 | 4 | 2 | 1 | 2 | 1 |
,标准差.(Ⅰ)求表格中字母
的值;(Ⅱ)为评判该公司的销售水平,用频率近似估计概率,从上述100天的销售业绩中随机抽取1天,记当天的销售数量为
,并根据以下不等式进行评判(表示相应事件的概率);①
;②;③.评判规则是:若同时满足上述三个不等式,则销售水平为优秀;仅满足其中两个,则等级为良好;若仅满足其中一个,则等级为合格;若全部不满足,则等级为不合格.试判断该公司的销售水平;
(Ⅲ)从上述100天的样本中随机抽取2个,记样本数据落在
内的数量为,求的分布列和数学期望.
您最近一年使用:0次


